## Bar Chart and Data Table: Legal Sector IT Spending and Consultancy Income
### Overview
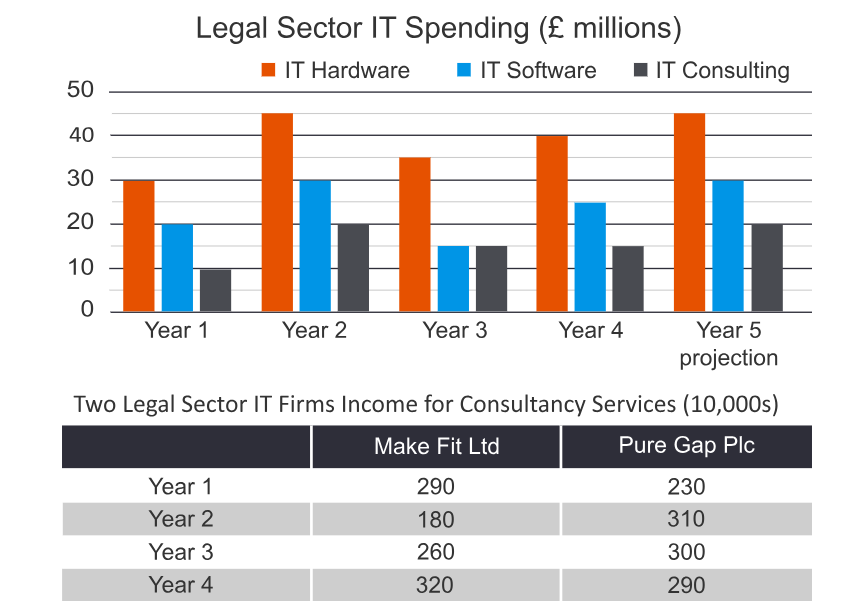
The image contains two distinct data visualizations related to the legal sector's IT expenditure. The top section is a grouped bar chart titled "Legal Sector IT Spending (£ millions)" showing spending across three IT categories over five years. The bottom section is a data table titled "Two Legal Sector IT Firms Income for Consultancy Services (10,000s)" comparing the income of two specific firms over four years.
### Components/Axes
**Bar Chart:**
* **Title:** Legal Sector IT Spending (£ millions)
* **Y-Axis:** Numerical scale from 0 to 50, with increments of 10. Represents spending in millions of British pounds (£).
* **X-Axis:** Categorical labels for five time periods: "Year 1", "Year 2", "Year 3", "Year 4", and "Year 5 projection".
* **Legend:** Located at the top center, below the title.
* Orange square: "IT Hardware"
* Blue square: "IT Software"
* Dark gray square: "IT Consulting"
**Data Table:**
* **Title:** Two Legal Sector IT Firms Income for Consultancy Services (10,000s)
* **Structure:** A 5-row by 3-column table.
* **Column Headers (from left to right):** (Empty cell), "Make Fit Ltd", "Pure Gap Plc".
* **Row Labels (from top to bottom):** "Year 1", "Year 2", "Year 3", "Year 4".
* **Unit:** Income values are in tens of thousands (10,000s).
### Detailed Analysis
**Bar Chart Data (Approximate Values in £ millions):**
* **Year 1:** IT Hardware ≈ 30, IT Software ≈ 20, IT Consulting ≈ 10.
* **Year 2:** IT Hardware ≈ 45, IT Software ≈ 30, IT Consulting ≈ 20.
* **Year 3:** IT Hardware ≈ 35, IT Software ≈ 15, IT Consulting ≈ 15.
* **Year 4:** IT Hardware ≈ 40, IT Software ≈ 25, IT Consulting ≈ 15.
* **Year 5 (projection):** IT Hardware ≈ 45, IT Software ≈ 30, IT Consulting ≈ 20.
**Data Table Content (Income in 10,000s):**
| | Make Fit Ltd | Pure Gap Plc |
| :--- | :--- | :--- |
| **Year 1** | 290 | 230 |
| **Year 2** | 180 | 310 |
| **Year 3** | 260 | 300 |
| **Year 4** | 320 | 290 |
### Key Observations
1. **IT Hardware Dominance:** IT Hardware is consistently the largest spending category across all five years, with peaks in Year 2 and the Year 5 projection (both ≈ £45m).
2. **Software Volatility:** IT Software spending shows more fluctuation, with a notable dip in Year 3 (≈ £15m) before recovering.
3. **Consulting Stability:** IT Consulting spending is the lowest and most stable category, hovering between £10m and £20m.
4. **Firm Income Divergence:** The two consultancy firms show contrasting income trends. Make Fit Ltd's income dips sharply in Year 2 (180) before recovering and growing to its highest point in Year 4 (320). Pure Gap Plc's income peaks in Year 2 (310) and then shows a slight, gradual decline.
5. **Inverse Relationship (Year 2):** In Year 2, when overall IT Consulting sector spending increased (from £10m to £20m), Make Fit Ltd's income fell significantly, while Pure Gap Plc's income rose sharply.
### Interpretation
The data suggests a legal sector IT market where hardware investment is the primary and growing expenditure, possibly indicating ongoing infrastructure modernization. The volatility in software spending could reflect project-based purchasing cycles or shifting technological priorities.
The consultancy income table provides a micro-level view within the broader "IT Consulting" spending category. The inverse performance of the two firms in Year 2 is a critical anomaly. It implies that increased sector-wide spending on consulting does not benefit all firms equally; market share may be shifting, or firms may be specializing in different, non-competing services. Make Fit Ltd's recovery and growth by Year 4 suggest a successful strategic adjustment after its Year 2 slump. Pure Gap Plc's slight decline after its Year 2 peak could indicate market saturation for its specific service offerings or increased competition.
**Relationship Between Charts:** While the bar chart shows overall sector spending on IT Consulting rising from Year 1 to Year 2 (from £10m to £20m), the table reveals this aggregate growth masked a significant redistribution of income between two major players. This highlights the importance of examining both macro-sector trends and micro-firm performance to understand market dynamics fully. The unit difference (£ millions vs. 10,000s) means the firms' incomes represent a small but measurable portion of the total sector consulting spend.