\n
## Chart: Search Space Size Comparison
### Overview
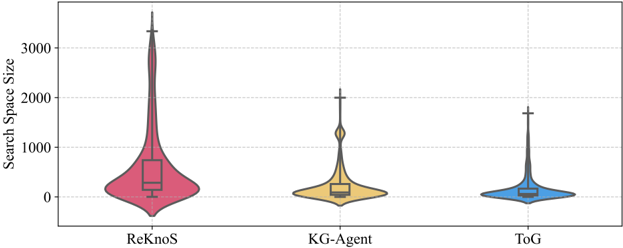
The image presents a comparative analysis of the search space size for three different methods: ReKnoS, KG-Agent, and ToG. The data is visualized using violin plots with box plots overlaid, indicating the distribution of search space sizes for each method.
### Components/Axes
* **X-axis:** Method Name (ReKnoS, KG-Agent, ToG)
* **Y-axis:** Search Space Size (Scale ranges from approximately 0 to 3200, with increments of 500)
* **Violin Plots:** Represent the distribution of search space sizes for each method.
* **Box Plots:** Overlaid on the violin plots, showing the median, quartiles, and outliers.
### Detailed Analysis
The chart displays the distribution of search space sizes for each method.
* **ReKnoS (Red):** The violin plot is widest and extends to the highest values. The median search space size appears to be around 600-700. The interquartile range (IQR) is substantial, indicating a wide spread of values. The "whiskers" extend to approximately 2500-3000, with some outliers reaching the maximum value of the y-axis (approximately 3200).
* **KG-Agent (Yellow):** The violin plot is narrower than ReKnoS, and the distribution is centered at a lower value. The median search space size is approximately 800-900. The IQR is smaller than ReKnoS, suggesting less variability. The whiskers extend to approximately 1800-2000.
* **ToG (Blue):** The violin plot is the narrowest, indicating the most concentrated distribution. The median search space size is approximately 900-1000. The IQR is the smallest of the three methods, indicating the least variability. The whiskers extend to approximately 1500-1800.
### Key Observations
* ReKnoS has the largest search space size, with the widest distribution and highest outliers.
* KG-Agent has a moderate search space size, with a narrower distribution than ReKnoS.
* ToG has the smallest search space size, with the most concentrated distribution.
* The distributions are not symmetrical for any of the methods.
### Interpretation
The data suggests that ReKnoS explores a significantly larger search space compared to KG-Agent and ToG. This could be due to the method's inherent design or the specific problem it is applied to. A larger search space can potentially lead to better solutions but also increases computational cost. KG-Agent and ToG appear to be more focused in their search, potentially sacrificing exploration for efficiency. The narrow distributions of KG-Agent and ToG suggest more consistent performance, while the wider distribution of ReKnoS indicates greater variability in search space size. The presence of outliers in ReKnoS suggests that, in some cases, the search space can become exceptionally large. This could be a potential area for optimization or further investigation. The differences in search space size could be related to the complexity of the problem being solved, the effectiveness of the search algorithms, or the quality of the knowledge representation used by each method.