## 3D Scatter Plot: Token Embedding Trajectory in PCA Space
### Overview
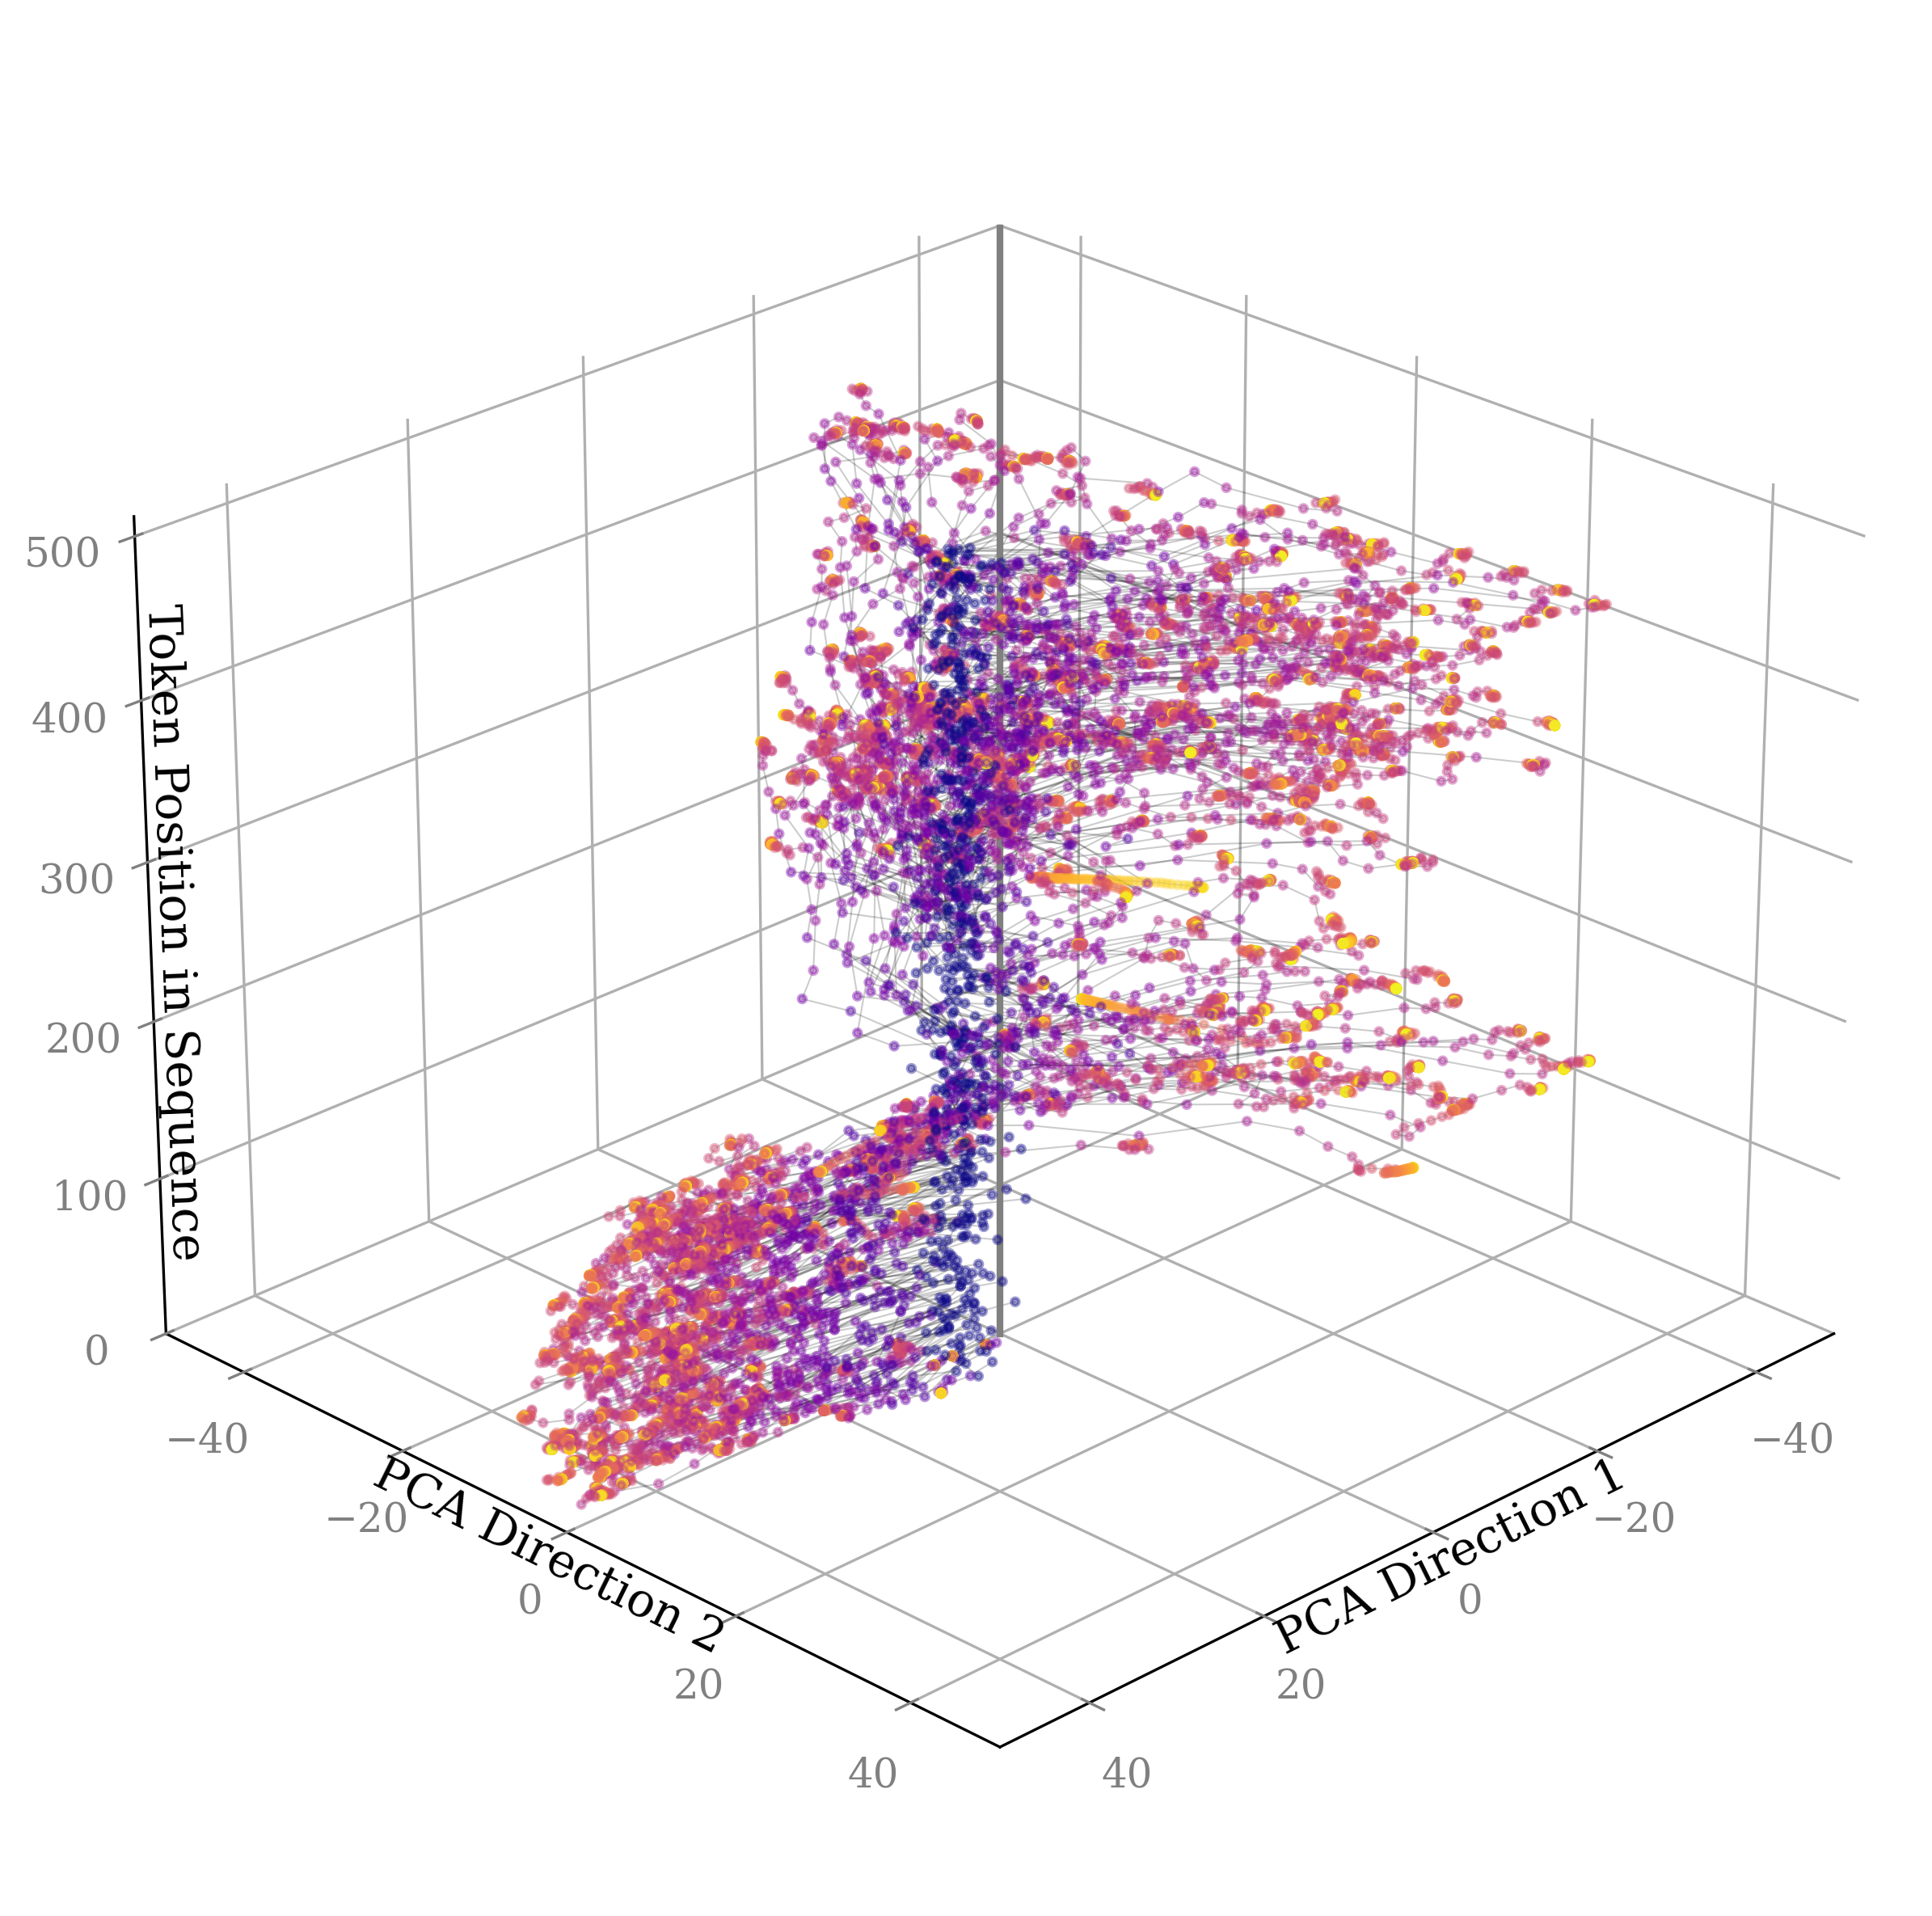
This image is a 3D scatter plot visualizing the trajectory of token embeddings from a sequence (likely from a language model) as they are projected into a three-dimensional space defined by the first two Principal Component Analysis (PCA) directions and the token's original position in the sequence. The plot reveals a complex, structured manifold with distinct clustering and connectivity patterns.
### Components/Axes
* **X-Axis (Bottom Right):** Labeled **"PCA Direction 1"**. Scale ranges from approximately -40 to +40, with major tick marks at -40, -20, 0, 20, 40.
* **Y-Axis (Bottom Left):** Labeled **"PCA Direction 2"**. Scale ranges from approximately -40 to +40, with major tick marks at -40, -20, 0, 20, 40.
* **Z-Axis (Vertical Left):** Labeled **"Token Position in Sequence"**. Scale ranges from 0 to 500, with major tick marks at 0, 100, 200, 300, 400, 500.
* **Data Points:** Thousands of individual points, each representing a token's embedding. Points are colored on a gradient from deep purple/blue to bright yellow/orange.
* **Connectivity:** Thin, semi-transparent grey lines connect points, presumably indicating sequential order (token `n` is connected to token `n+1`).
* **Legend/Color Bar:** **Not present in the image.** The color mapping (e.g., what the purple-to-yellow gradient represents) is not explicitly defined. Based on common practice, it likely encodes a fourth variable such as attention weight, layer depth, or another embedding dimension.
### Detailed Analysis
The data forms a distinct, non-random structure within the 3D space:
1. **Spatial Distribution & Clusters:**
* **Lower Cluster (Token Positions ~0-150):** A dense, roughly spherical or ellipsoidal cluster is located in the lower region of the plot. Its center is approximately at PCA1 ≈ -10, PCA2 ≈ -10, Token Position ≈ 50. The points within this cluster are tightly packed.
* **Upper Manifold (Token Positions ~150-500):** Above the lower cluster, the data expands into a more complex, sheet-like or branching structure. This upper region is less dense and more spread out, particularly along the PCA Direction 1 axis. It appears to have a central "spine" or vertical column near PCA1 ≈ 0, PCA2 ≈ 0, from which branches extend outward.
* **Vertical Alignment:** There is a clear vertical trend where the overall structure ascends along the "Token Position in Sequence" axis.
2. **Color Distribution:**
* The color gradient (purple → magenta → orange → yellow) is not randomly scattered.
* **Lower Cluster:** Dominated by purple and magenta points, with some orange/yellow points interspersed.
* **Upper Manifold:** Shows a much higher concentration of orange and yellow points, especially in the more dispersed, outer regions. The central "spine" retains more purple/magenta points.
* **Trend:** There is a visual correlation where points at higher token positions (higher Z-value) and those further from the central axis (higher absolute PCA1/PCA2 values) tend to be more yellow/orange.
3. **Connectivity Pattern:**
* The connecting lines create a dense web, making the sequential path difficult to trace individually.
* The connectivity reinforces the two-cluster structure, with many lines running vertically within the lower cluster and then extending upward into the upper manifold.
### Key Observations
* **Bimodal Distribution:** The most striking feature is the separation into a dense, early-token cluster and a diffuse, late-token manifold.
* **Structured Manifold:** The data does not fill the space uniformly. It occupies a specific, curved sub-space, suggesting strong underlying constraints on the token embeddings.
* **Color-Position Correlation:** The apparent shift from cool colors (purple) at low token positions to warm colors (yellow) at high token positions and in dispersed areas is a significant pattern, though its exact meaning is undefined without a legend.
* **Central Tendency:** A vertical column of points near (PCA1=0, PCA2=0) persists across all token positions, acting as a backbone for the structure.
### Interpretation
This visualization likely represents the evolution of internal representations (embeddings) within a transformer-based language model as it processes a long sequence.
* **Semantic/Contextual Drift:** The transition from a tight cluster to a dispersed manifold suggests that the model's representation of tokens changes significantly as the sequence progresses. Early tokens (low position) may be processed in a more uniform, context-agnostic way, while later tokens develop more specialized, context-dependent representations that vary widely (hence the dispersion).
* **Attention and Information Flow:** The vertical "spine" could represent a core set of tokens or a persistent context that remains central throughout processing. The branching structures might illustrate how information from this core is modulated and combined to form the representations of subsequent tokens.
* **Dimensionality Reduction Insight:** The use of PCA Directions 1 and 2 indicates that the most significant variance in the high-dimensional embedding space can be captured in these two dimensions. The 3D plot adds the crucial temporal (sequence position) dimension, revealing how the principal components of the representation evolve.
* **Model Behavior Hypothesis:** The pattern is consistent with a model that establishes a strong initial context (the lower cluster) and then uses that foundation to generate a diverse set of subsequent representations, potentially reflecting the increasing complexity of syntactic and semantic relationships as the sequence unfolds. The color gradient, if it represents something like "surprise" or "information content," would support this, with later, more context-specific tokens having higher values (yellow).
**Note on Uncertainty:** Without a legend for the color scale and the specific model/data context, the interpretation of the color gradient and the precise meaning of the clusters remains inferential. The spatial relationships and trends, however, are directly observable from the plot's geometry.