TECHNICAL ASSET FINGERPRINT
3e8ff9c04c70c9385127d1f1
Click to view fullscreen
Press ESC or click to close
FOUND IN PAPERS
EXPERT: healer-alpha-free VERSION 1
RUNTIME: free/openrouter/healer-alpha
INTEL_VERIFIED
## Heatmap: Layer-wise Token Activation/Attention Intensity
### Overview
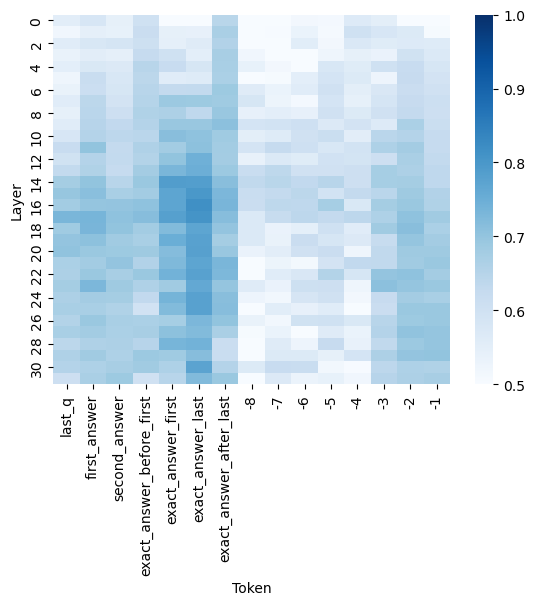
The image is a heatmap visualization, likely representing the intensity of attention weights, activation values, or another saliency metric across different layers of a neural network model for specific tokens in a sequence. The chart shows how the importance or activation of certain tokens varies as information propagates through the model's layers.
### Components/Axes
* **Chart Type:** Heatmap.
* **Y-Axis (Vertical):** Labeled **"Layer"**. It represents the depth within the neural network, with values ranging from **0** at the top to **30** at the bottom, in increments of 2 (0, 2, 4, ..., 30).
* **X-Axis (Horizontal):** Labeled **"Token"**. It lists specific tokens or positions in an input sequence. The labels, from left to right, are:
1. `last_q`
2. `first_answer`
3. `second_answer`
4. `exact_answer_before_first`
5. `exact_answer_first`
6. `exact_answer_last`
7. `exact_answer_after_last`
8. `-8`
9. `-7`
10. `-6`
11. `-5`
12. `-4`
13. `-3`
14. `-2`
15. `-1`
* **Color Scale/Legend:** Positioned on the **right side** of the chart. It is a vertical color bar indicating the value mapped to each cell's color. The scale ranges from **0.5** (lightest blue/white) at the bottom to **1.0** (darkest blue) at the top. The gradient moves from white/light blue (low value) through medium blue to dark navy blue (high value).
### Detailed Analysis
The heatmap is a grid where each cell's color corresponds to a value between 0.5 and 1.0 for a specific (Layer, Token) pair.
**Spatial & Color Analysis:**
* **High-Value Clusters (Dark Blue):** The most intense, dark blue cells (values approaching 1.0) are concentrated in two primary columns:
* **`exact_answer_first` (Column 5):** Shows consistently high values (dark blue) from approximately **Layer 10 down to Layer 30**. The intensity appears strongest around **Layers 14-22**.
* **`exact_answer_last` (Column 6):** Also exhibits very high values, particularly from **Layer 12 to Layer 30**, with a peak intensity similar to `exact_answer_first`.
* **Moderate-Value Regions (Medium Blue):**
* The columns for `exact_answer_before_first` (Column 4) and `exact_answer_after_last` (Column 7) show medium blue shades, indicating moderate values (approx. 0.7-0.85), especially in the middle to lower layers (10-30).
* The column for `last_q` (Column 1) displays a patchy pattern of medium blue, with some higher values in the very early layers (0-6) and again in the mid-layers.
* **Low-Value Regions (Light Blue/White):**
* The columns labeled with negative numbers (`-8` to `-1`, Columns 8-15) are predominantly light blue or white, indicating values closer to the lower end of the scale (0.5-0.65). This suggests these positional tokens have relatively low saliency/activation across all layers.
* The tokens `first_answer` (Column 2) and `second_answer` (Column 3) also show generally low to moderate values, lighter than the "exact_answer" columns.
**Trend Verification:**
* **Vertical Trend (Across Layers):** For the high-value tokens (`exact_answer_first`, `exact_answer_last`), the trend is not linear. Values start low in the initial layers (0-8), increase sharply in the middle layers (10-20), and remain high through the final layers (22-30). This suggests these tokens become critically important in the model's intermediate processing stages.
* **Horizontal Trend (Across Tokens):** There is a clear hierarchy of token importance. The "exact answer" boundary tokens (`first`, `last`) are the most salient, followed by their immediate context (`before_first`, `after_last`), then the question token (`last_q`), and finally the generic answer tokens and positional indices, which are the least salient.
### Key Observations
1. **Token Specificity Matters:** The model pays dramatically more attention to tokens explicitly marking the boundaries of the "exact answer" (`exact_answer_first`, `exact_answer_last`) compared to generic answer tokens (`first_answer`, `second_answer`) or positional indices.
2. **Mid-Layer Focus:** The peak activation for critical tokens occurs in the middle to late layers (10-30), not in the earliest embedding layers. This aligns with the understanding that deeper layers in transformers often handle more abstract, task-specific reasoning.
3. **Positional Token Noise:** The low, uniform values for the numbered positional tokens (`-8` to `-1`) suggest they serve as background or structural elements without carrying significant task-specific information in this context.
4. **Symmetry around Answer:** The columns `exact_answer_before_first` and `exact_answer_after_last` show similar, moderate intensity patterns, indicating the model attends to the context immediately surrounding the answer span.
### Interpretation
This heatmap provides a technical window into the internal mechanics of a language model, likely during a question-answering task. The data suggests the model has learned to **precisely localize the answer span** by assigning high importance to the tokens that demarcate its start (`exact_answer_first`) and end (`exact_answer_last`). This focus intensifies as the signal propagates through the network's layers, peaking in the mid-to-deep layers where complex feature integration occurs.
The stark contrast between the high-value "exact answer" columns and the low-value positional columns indicates the model is not merely relying on token position but is performing **content-based attention**. It successfully identifies and prioritizes the semantically crucial tokens for the task. The moderate attention to the immediate context (`before_first`, `after_last`) may reflect the model verifying the answer's coherence with its surrounding text.
**Notable Anomaly:** The token `last_q` (presumably the last token of the question) shows some early-layer activation, which is logical as the question is processed first. However, its importance does not peak as dramatically as the answer-boundary tokens in deeper layers, suggesting the model's focus shifts decisively from question understanding to answer extraction as processing depth increases.
In summary, this visualization demonstrates a model that has developed an efficient internal strategy: it uses specific, learned boundary markers to isolate the answer span, dedicating its computational resources (attention/activation) most heavily to these critical points during deep processing.
DECODING INTELLIGENCE...