## Chart: Generalization Error vs. n/d^2
### Overview
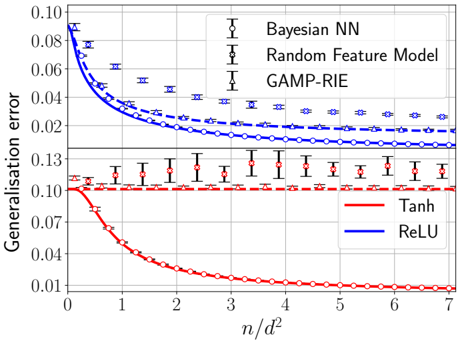
The image is a line chart comparing the generalization error of different models as a function of the ratio n/d^2. The chart displays two distinct sets of models: Bayesian NN, Random Feature Model, and GAMP-RIE in the upper portion, and Tanh and ReLU in the lower portion. The x-axis represents n/d^2, and the y-axis represents the generalization error. Error bars are included for some data series.
### Components/Axes
* **X-axis:** n/d^2, ranging from 0 to 7. Axis markers are present at integer values.
* **Y-axis:** Generalisation error, ranging from 0.01 to 0.10 in the lower portion and from 0.02 to 0.10 in the upper portion, with an additional marker at 0.13.
* **Legend (Top-Right):**
* Bayesian NN (Black, circles): Data points are marked with circles.
* Random Feature Model (Black, crosses): Data points are marked with crosses.
* GAMP-RIE (Black, triangles): Data points are marked with triangles.
* **Legend (Bottom-Right):**
* Tanh (Red, circles): Data points are marked with circles.
* ReLU (Blue, solid line): No data points are explicitly marked on the line.
### Detailed Analysis
**Upper Portion:**
* **Bayesian NN (Blue, circles):** The blue line with circle markers starts at approximately 0.085 at n/d^2 = 0 and decreases to approximately 0.015 at n/d^2 = 7. The trend is downward, indicating decreasing generalization error with increasing n/d^2.
* n/d^2 = 0: ~0.085
* n/d^2 = 1: ~0.045
* n/d^2 = 2: ~0.03
* n/d^2 = 3: ~0.02
* n/d^2 = 7: ~0.015
* **Random Feature Model (Blue, crosses):** The blue dashed line with cross markers starts at approximately 0.09 at n/d^2 = 0 and decreases to approximately 0.03 at n/d^2 = 7. The trend is downward, indicating decreasing generalization error with increasing n/d^2.
* n/d^2 = 0: ~0.09
* n/d^2 = 1: ~0.06
* n/d^2 = 2: ~0.045
* n/d^2 = 3: ~0.035
* n/d^2 = 7: ~0.03
* **GAMP-RIE (Blue, triangles):** The blue dashed line with triangle markers starts at approximately 0.09 at n/d^2 = 0 and decreases to approximately 0.03 at n/d^2 = 7. The trend is downward, indicating decreasing generalization error with increasing n/d^2.
* n/d^2 = 0: ~0.09
* n/d^2 = 1: ~0.05
* n/d^2 = 2: ~0.035
* n/d^2 = 3: ~0.03
* n/d^2 = 7: ~0.025
**Lower Portion:**
* **Tanh (Red, circles):** The red line with circle markers starts at approximately 0.10 at n/d^2 = 0 and decreases to approximately 0.01 at n/d^2 = 7. The trend is downward, indicating decreasing generalization error with increasing n/d^2.
* n/d^2 = 0: ~0.10
* n/d^2 = 1: ~0.04
* n/d^2 = 2: ~0.025
* n/d^2 = 3: ~0.015
* n/d^2 = 7: ~0.01
* **ReLU (Red, triangles):** The red dashed line with triangle markers remains relatively constant at approximately 0.11 across all values of n/d^2. The trend is flat, indicating no significant change in generalization error with increasing n/d^2. Error bars are present.
* n/d^2 = 0: ~0.11
* n/d^2 = 1: ~0.11
* n/d^2 = 2: ~0.115
* n/d^2 = 3: ~0.11
* n/d^2 = 7: ~0.11
### Key Observations
* The generalization error for Bayesian NN, Random Feature Model, GAMP-RIE, and Tanh decreases as n/d^2 increases.
* The generalization error for ReLU remains relatively constant as n/d^2 increases.
* The Tanh model exhibits the lowest generalization error at higher values of n/d^2.
* The ReLU model exhibits a higher, relatively constant generalization error.
### Interpretation
The chart suggests that, for the given models, increasing the ratio of 'n' to 'd^2' generally leads to a reduction in generalization error, implying better model performance with more data relative to the model's complexity. However, this trend is not universal, as demonstrated by the ReLU model, which shows no significant improvement with increasing n/d^2. The Tanh model appears to be the most effective in reducing generalization error as n/d^2 increases, outperforming the other models at higher values of n/d^2. The error bars on the ReLU model indicate some variability in its performance, but the overall trend remains consistent. The Bayesian NN, Random Feature Model, and GAMP-RIE models exhibit similar trends, with decreasing generalization error as n/d^2 increases, but their performance is generally worse than Tanh at higher values of n/d^2.