\n
## Line Chart: Max Logits vs. Training Steps
### Overview
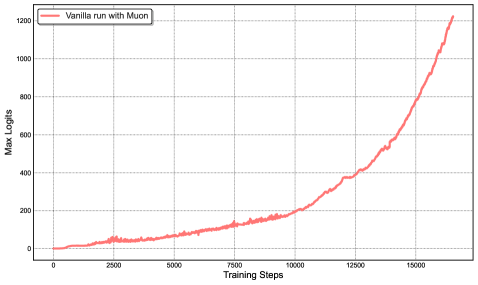
The image presents a line chart illustrating the relationship between "Training Steps" and "Max Logits" for a "Vanilla run with Muon". The chart shows how the maximum logits value changes as the training progresses.
### Components/Axes
* **X-axis:** "Training Steps" - ranging from 0 to approximately 16000, with gridlines at 2500, 5000, 7500, 10000, 12500, and 15000.
* **Y-axis:** "Max Logits" - ranging from 0 to 1200, with gridlines at 0, 200, 400, 600, 800, and 1000.
* **Legend:** Located in the top-left corner, labeled "Vanilla run with Muon" and associated with a red line.
### Detailed Analysis
The chart displays a single data series represented by a red line. The line starts at approximately (0, 0) and exhibits a slow, almost linear increase until around 10000 Training Steps. After this point, the line begins to curve upwards more steeply, indicating an accelerating increase in Max Logits.
Here's an approximate extraction of data points:
* (0, 0)
* (2500, ~30)
* (5000, ~70)
* (7500, ~130)
* (10000, ~220)
* (12500, ~380)
* (15000, ~900)
* (16000, ~1200)
The trend is initially slow and steady, then becomes increasingly exponential.
### Key Observations
* The initial phase of training (0-10000 steps) shows a relatively gradual increase in Max Logits.
* A significant inflection point occurs around 10000 Training Steps, after which the Max Logits increase rapidly.
* The final data points suggest the model is approaching a point of convergence or saturation, as the rate of increase in Max Logits remains high.
### Interpretation
The chart likely represents the training process of a machine learning model. The "Max Logits" value could be an indicator of the model's confidence or the strength of its predictions. The initial slow increase suggests the model is learning basic features and patterns. The subsequent rapid increase indicates that the model is starting to converge and refine its predictions. The inflection point around 10000 steps could be due to a change in the learning rate, the introduction of a new optimization technique, or simply the model reaching a critical stage in its learning process. The steep increase at the end suggests the model is nearing completion of training, but further training might be needed to achieve optimal performance. The data suggests a successful training run, as the Max Logits are consistently increasing, indicating the model is improving its ability to make accurate predictions.