## Line Chart: Information Gain and R² Value vs. Training Steps
### Overview
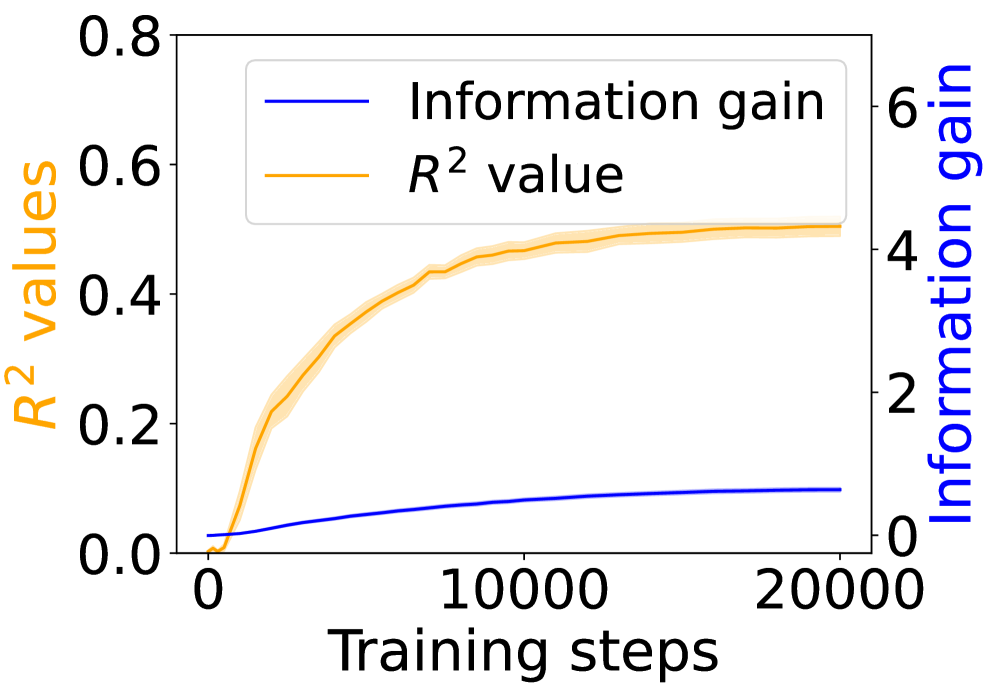
The image is a line chart showing the relationship between training steps and two metrics: Information Gain and R² value. The x-axis represents training steps, while the left y-axis represents R² values, and the right y-axis represents Information Gain. The chart displays how these metrics change as the number of training steps increases.
### Components/Axes
* **X-axis:** Training steps, ranging from 0 to 20000.
* **Left Y-axis:** R² values, ranging from 0.0 to 0.8.
* **Right Y-axis:** Information gain, ranging from 0 to 6.
* **Legend:** Located at the top-center of the chart.
* Blue line: Information gain
* Orange line: R² value
### Detailed Analysis
* **Information Gain (Blue Line):** The information gain starts at approximately 0 and gradually increases with training steps. The rate of increase slows down as the number of training steps increases, reaching a value of approximately 0.8 at 20000 training steps.
* At 0 training steps, Information Gain ≈ 0.
* At 20000 training steps, Information Gain ≈ 0.8.
* **R² Value (Orange Line):** The R² value starts at approximately 0 and increases rapidly with training steps initially. The rate of increase slows down as the number of training steps increases, approaching a plateau around 0.5 at 20000 training steps. The orange line has a shaded region around it, indicating variability or uncertainty.
* At 0 training steps, R² value ≈ 0.02.
* At 5000 training steps, R² value ≈ 0.4.
* At 20000 training steps, R² value ≈ 0.5.
### Key Observations
* The R² value increases much more rapidly than the information gain in the initial training steps.
* Both metrics show diminishing returns as the number of training steps increases.
* The R² value appears to plateau at a lower value than what might be expected, given its initial rapid increase.
### Interpretation
The chart suggests that the model's performance, as measured by the R² value, improves significantly in the early stages of training. However, the rate of improvement decreases as training progresses, indicating that the model may be approaching its maximum potential performance. The information gain also increases with training, but at a slower rate compared to the R² value. This could indicate that while the model is learning, the information it gains from each additional training step diminishes over time. The shaded region around the R² value line suggests that there is some variability in the R² value, possibly due to the stochastic nature of the training process or the characteristics of the dataset.