## Line Graph: Model Performance Metrics Over Training Steps
### Overview
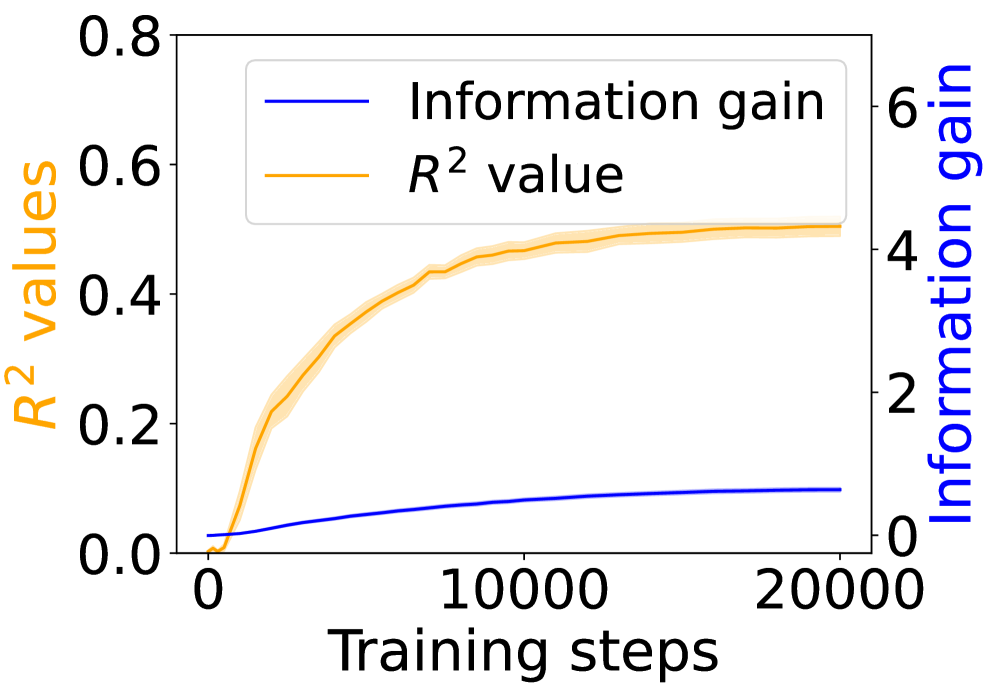
The image displays a dual-axis line graph tracking two performance metrics during model training: R² values (left y-axis) and Information gain (right y-axis) across 20,000 training steps. The graph includes a legend in the top-right corner and shaded uncertainty bands for the R² metric.
### Components/Axes
- **X-axis**: Training steps (0 to 20,000)
- **Left Y-axis**: R² values (0.0 to 0.8)
- **Right Y-axis**: Information gain (0 to 6)
- **Legend**:
- Blue line: Information gain
- Orange line: R² value
- **Shaded Area**: Uncertainty band around R² values (top-right corner)
### Detailed Analysis
1. **R² Values (Orange Line)**:
- Starts at 0.0 at step 0
- Rapidly increases to ~0.6 by 10,000 steps
- Plateaus between 0.6 and 0.75 after 10,000 steps
- Shaded uncertainty band widens initially, then narrows as training progresses
2. **Information Gain (Blue Line)**:
- Starts at 0.0 at step 0
- Gradual linear increase to ~1.2 by 20,000 steps
- Slope remains relatively constant throughout training
### Key Observations
- R² values show diminishing returns after ~10,000 steps, while Information gain continues increasing linearly
- The orange line's shaded uncertainty band suggests measurement variability decreases with more training
- Information gain metric scales 10x higher than R² values (6 vs 0.8 on respective axes)
### Interpretation
The data demonstrates two distinct learning phases:
1. **Early Training (0-10k steps)**:
- R² values show rapid improvement (0→0.6), indicating strong initial learning
- Information gain increases slowly (0→1.2), suggesting limited feature importance discovery
2. **Late Training (10k-20k steps)**:
- R² plateaus near 0.7, implying model saturation
- Information gain continues rising linearly (1.2→2.4), indicating ongoing discovery of subtle patterns
The divergence between metrics suggests potential overfitting risks: while predictive power (R²) stabilizes, the model continues accumulating information (possibly noise or irrelevant features). The uncertainty band around R² values highlights measurement reliability improvements with more training data.