## Scatter Plots: GFLOPS per Watt Estimation for CNN and NLP Models
### Overview
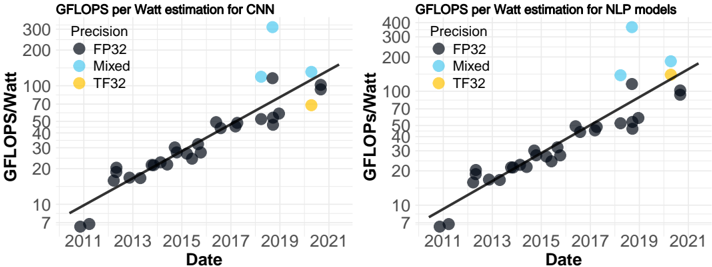
The image presents two scatter plots, side-by-side. The left plot shows GFLOPS per Watt estimation for Convolutional Neural Networks (CNN), and the right plot shows the same for Natural Language Processing (NLP) models. Both plots display data points over time (Date) and use different colors to represent different precision levels (FP32, Mixed, TF32). A black line represents a trendline for each plot.
### Components/Axes
Both plots share the following components:
* **X-axis:** Date, ranging from approximately 2010 to 2022, with markers at 2011, 2013, 2015, 2017, 2019, and 2021.
* **Y-axis:** GFLOPS/Watt, ranging from approximately 7 to 300 (left plot) and 7 to 400 (right plot).
* **Legend (Top-Left of each plot):**
* Precision: FP32 (Dark Gray)
* Precision: Mixed (Light Blue)
* Precision: TF32 (Yellow)
* **Trendline:** A black solid line representing the general trend of the data.
### Detailed Analysis or Content Details
**Left Plot (CNN):**
* **FP32 (Dark Gray):** The data points generally follow an upward trend.
* Approximate data points: (2011, 8), (2012, 12), (2013, 16), (2014, 20), (2015, 25), (2016, 30), (2017, 40), (2018, 50), (2019, 60), (2020, 80), (2021, 100).
* **Mixed (Light Blue):** Fewer data points are present.
* Approximate data points: (2017, 150), (2019, 200), (2021, 300).
* **TF32 (Yellow):** Only one data point is visible.
* Approximate data point: (2018, 45).
**Right Plot (NLP):**
* **FP32 (Dark Gray):** The data points generally follow an upward trend.
* Approximate data points: (2011, 7), (2012, 12), (2013, 18), (2014, 24), (2015, 30), (2016, 40), (2017, 50), (2018, 60), (2019, 70), (2020, 90), (2021, 110).
* **Mixed (Light Blue):** Fewer data points are present.
* Approximate data points: (2017, 180), (2019, 220), (2021, 320).
* **TF32 (Yellow):** Only one data point is visible.
* Approximate data point: (2018, 80).
In both plots, the trendlines slope upwards, indicating an increasing trend in GFLOPS per Watt over time.
### Key Observations
* Both CNN and NLP models show a consistent increase in GFLOPS per Watt over the period from 2011 to 2021.
* Mixed precision consistently outperforms FP32 precision in both CNN and NLP models, showing significantly higher GFLOPS/Watt.
* TF32 precision has limited data points, but appears to offer performance between FP32 and Mixed precision.
* The rate of improvement appears to be accelerating in recent years (2019-2021) for all precision levels.
### Interpretation
The data suggests a significant improvement in the efficiency of both CNN and NLP models over the past decade. This improvement is likely due to advancements in hardware (e.g., GPUs, TPUs) and software (e.g., model architectures, optimization techniques). The superior performance of Mixed precision indicates that utilizing lower precision data types can substantially increase computational throughput without significant loss of accuracy. The limited data for TF32 suggests it is a relatively newer precision format, but shows promise. The accelerating trend in recent years suggests that the pace of innovation in this field is increasing. The difference between the two charts could be due to the inherent computational demands of CNNs versus NLP models, or the different optimization strategies employed for each. The plots demonstrate the ongoing drive for more efficient machine learning models, which is crucial for reducing energy consumption and enabling deployment on resource-constrained devices.