## Line Chart: Question Importance Score vs. Step
### Overview
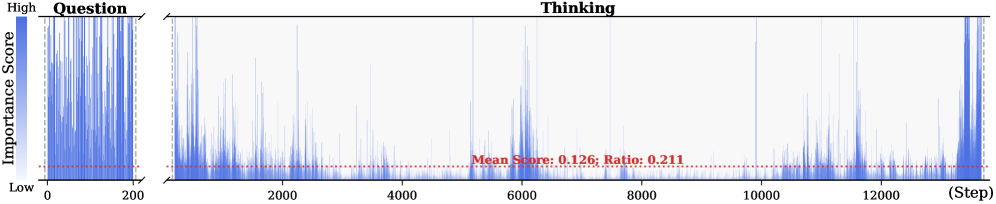
The image presents a line chart that visualizes the importance score of questions over a series of steps. The chart is divided into two sections: the "Question" section on the left, spanning steps 0-200, and the "Thinking" section on the right, spanning steps 200-14000. A horizontal dotted red line indicates the mean score and ratio.
### Components/Axes
* **Title:** Thinking
* **Y-axis:** "Importance Score" with a gradient scale from "Low" to "High" on the left.
* **X-axis:** "(Step)" ranging from 0 to approximately 14000. Tick marks are present at 0, 200, 2000, 4000, 6000, 8000, 10000, and 12000.
* **Data Series:** A blue line representing the importance score at each step.
* **Mean Score Line:** A horizontal dotted red line indicating "Mean Score: 0.126; Ratio: 0.211".
### Detailed Analysis
* **Question Section (Steps 0-200):** The importance score fluctuates rapidly and generally remains high. The blue line shows many peaks reaching near the "High" level of the y-axis.
* **Thinking Section (Steps 200-14000):** The importance score is generally lower than in the "Question" section. There are several spikes in importance score at approximately steps 2000, 4000, 6000, 10000, and 13000. The score remains relatively low between these spikes.
* **Mean Score:** The red dotted line representing the mean score is positioned relatively low on the y-axis, suggesting that the average importance score is closer to "Low" than "High".
### Key Observations
* The "Question" section exhibits significantly higher and more consistent importance scores compared to the "Thinking" section.
* The "Thinking" section shows periodic spikes in importance score, indicating moments of increased questioning or uncertainty.
* The mean score is relatively low, suggesting that the overall importance of questions is not consistently high throughout the entire process.
### Interpretation
The chart likely represents the importance of questions during a problem-solving or learning process. The initial "Question" phase (0-200 steps) is characterized by high questioning activity, possibly reflecting initial exploration and information gathering. The "Thinking" phase (200-14000 steps) shows a decrease in overall questioning, with intermittent spikes indicating moments where questions become more critical, perhaps when encountering challenges or new information. The relatively low mean score suggests that questioning is not a constant activity but rather a strategic one, used when needed to navigate the problem space. The ratio of 0.211 may represent the proportion of steps where the importance score exceeds a certain threshold, further emphasizing the intermittent nature of high-importance questions.