## Line Chart: Reward vs. Training Wall-Clock Time
### Overview
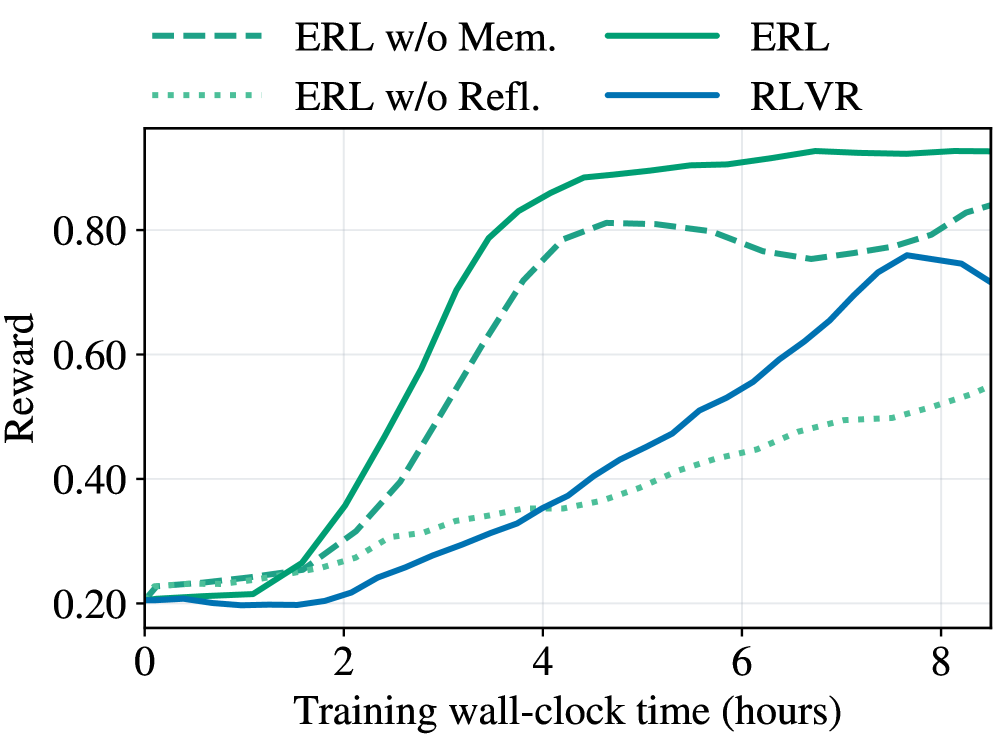
The image is a line chart comparing the performance of four different algorithms (ERL, ERL w/o Mem., ERL w/o Refl., and RLVR) over a period of 8 hours of training. The y-axis represents the "Reward," ranging from 0.20 to 0.80. The x-axis represents "Training wall-clock time (hours)," ranging from 0 to 8.
### Components/Axes
* **X-axis:** Training wall-clock time (hours). Scale ranges from 0 to 8, with tick marks at every 2 hours.
* **Y-axis:** Reward. Scale ranges from 0.20 to 0.80, with tick marks at intervals of 0.20.
* **Legend:** Located at the top of the chart.
* ERL w/o Mem.: Dashed green line
* ERL: Solid green line
* ERL w/o Refl.: Dotted green line
* RLVR: Solid blue line
### Detailed Analysis
* **ERL (Solid Green):**
* Trend: Initially increases rapidly, plateaus around 0.85 after 4 hours.
* Data Points: Starts at approximately 0.22 at 0 hours, reaches approximately 0.85 around 4 hours, and remains relatively stable around 0.85-0.90 until 8 hours.
* **ERL w/o Mem. (Dashed Green):**
* Trend: Increases rapidly, peaks around 0.82 at 5 hours, then decreases slightly.
* Data Points: Starts at approximately 0.22 at 0 hours, reaches approximately 0.82 around 5 hours, and decreases to approximately 0.75 at 8 hours.
* **ERL w/o Refl. (Dotted Green):**
* Trend: Slow, steady increase.
* Data Points: Starts at approximately 0.22 at 0 hours, reaches approximately 0.55 at 8 hours.
* **RLVR (Solid Blue):**
* Trend: Slow initial increase, followed by a more rapid increase after 4 hours.
* Data Points: Starts at approximately 0.20 at 0 hours, remains relatively flat until 2 hours, then increases to approximately 0.75 at 8 hours.
### Key Observations
* ERL (solid green) and ERL w/o Mem. (dashed green) initially perform much better than ERL w/o Refl. (dotted green) and RLVR (solid blue).
* ERL w/o Mem. (dashed green) peaks and then declines slightly, while ERL (solid green) plateaus.
* RLVR (solid blue) shows a delayed but significant increase in reward after 4 hours.
* ERL w/o Refl. (dotted green) consistently shows the lowest reward throughout the training period.
### Interpretation
The chart compares the performance of different reinforcement learning algorithms. The ERL algorithm, both with and without memory, initially outperforms the RLVR algorithm. However, the RLVR algorithm eventually catches up, suggesting that it may benefit from longer training periods. The ERL algorithm without reflection consistently performs the worst, indicating that reflection is an important component of the ERL algorithm. The ERL algorithm with memory peaks and then declines, suggesting that memory may not be beneficial for long training periods.