\n
## Line Chart: Training Reward Over Time for Different Algorithms
### Overview
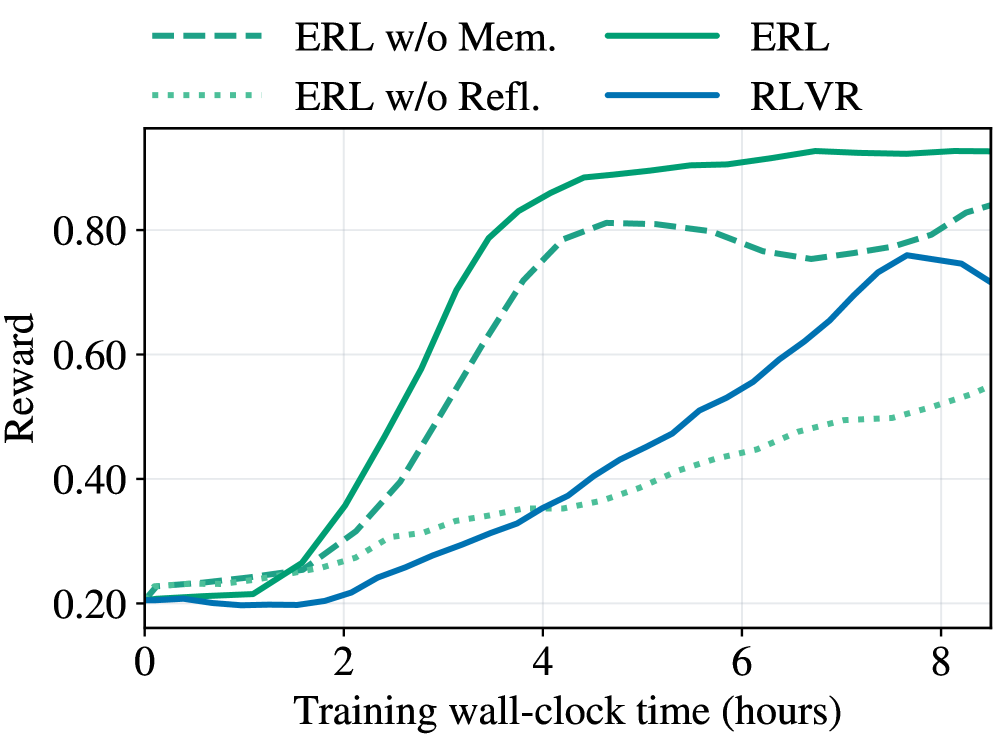
The image displays a line chart comparing the performance of four reinforcement learning algorithms over training time. The chart plots "Reward" on the vertical axis against "Training wall-clock time (hours)" on the horizontal axis. The primary purpose is to demonstrate the learning efficiency and final performance of the "ERL" algorithm and its variants compared to "RLVR".
### Components/Axes
* **Chart Type:** Multi-line chart.
* **X-Axis:**
* **Label:** "Training wall-clock time (hours)"
* **Scale:** Linear, from 0 to approximately 8.5 hours.
* **Major Tick Marks:** 0, 2, 4, 6, 8.
* **Y-Axis:**
* **Label:** "Reward"
* **Scale:** Linear, from 0.20 to approximately 0.95.
* **Major Tick Marks:** 0.20, 0.40, 0.60, 0.80.
* **Legend:** Positioned at the top center of the chart area. It contains four entries, each with a distinct line style and color:
1. `--- ERL w/o Mem.` (Dashed green line)
2. `... ERL w/o Refl.` (Dotted green line)
3. `─── ERL` (Solid green line)
4. `─── RLVR` (Solid blue line)
### Detailed Analysis
**Trend Verification & Data Point Extraction:**
1. **ERL (Solid Green Line):**
* **Trend:** Shows the fastest and highest learning curve. It begins at a reward of ~0.20, experiences a sharp, near-exponential increase starting around 1.5 hours, and plateaus at the highest reward level.
* **Approximate Data Points:**
* 0 hrs: ~0.20
* 2 hrs: ~0.35
* 4 hrs: ~0.85
* 6 hrs: ~0.92
* 8 hrs: ~0.93 (Peak appears around 7 hrs at ~0.94)
2. **ERL w/o Mem. (Dashed Green Line):**
* **Trend:** Follows a similar shape to the full ERL model but with consistently lower reward values after the initial phase. It peaks and then shows a slight decline before a final uptick.
* **Approximate Data Points:**
* 0 hrs: ~0.22
* 2 hrs: ~0.30
* 4 hrs: ~0.75
* 6 hrs: ~0.78
* 8 hrs: ~0.83 (Peak around 5 hrs at ~0.81, dip to ~0.75 at 7 hrs)
3. **RLVR (Solid Blue Line):**
* **Trend:** Starts the lowest, remains flat for the first 2 hours, then begins a steady, roughly linear increase. It surpasses the "ERL w/o Refl." model around 4 hours and peaks before a noticeable decline at the end of the plotted time.
* **Approximate Data Points:**
* 0 hrs: ~0.20
* 2 hrs: ~0.20
* 4 hrs: ~0.35
* 6 hrs: ~0.55
* 8 hrs: ~0.72 (Peak around 7.5 hrs at ~0.76)
4. **ERL w/o Refl. (Dotted Green Line):**
* **Trend:** Exhibits the slowest and most gradual improvement. It maintains a steady, shallow upward slope throughout the entire training period, never achieving a high reward.
* **Approximate Data Points:**
* 0 hrs: ~0.21
* 2 hrs: ~0.28
* 4 hrs: ~0.35
* 6 hrs: ~0.45
* 8 hrs: ~0.55
### Key Observations
1. **Performance Hierarchy:** The full ERL algorithm significantly outperforms all other variants and the RLVR baseline in both learning speed and final reward.
2. **Ablation Impact:** Removing the "Memory" component (`ERL w/o Mem.`) causes a moderate performance drop. Removing the "Reflection" component (`ERL w/o Refl.`) causes a severe performance degradation, resulting in the worst-performing model.
3. **Learning Dynamics:** ERL and its memory-ablated variant learn rapidly in the first 4 hours. RLVR has a delayed start but learns steadily. The reflection-ablated model learns slowly and linearly.
4. **Late-Stage Behavior:** The `ERL` and `ERL w/o Mem.` lines show signs of plateauing or slight fluctuation after 6 hours. The `RLVR` line shows a distinct performance drop after its peak at ~7.5 hours.
### Interpretation
This chart provides strong evidence for the efficacy of the proposed ERL (Evolutionary Reinforcement Learning) framework and the importance of its core components.
* **Component Contribution:** The stark contrast between the solid green line (full ERL) and the dotted green line (without Reflection) suggests that the "Reflection" mechanism is critical for efficient learning and achieving high performance. The "Memory" component also contributes positively, as its removal leads to a consistent performance gap.
* **Algorithmic Comparison:** ERL demonstrates superior sample efficiency (in wall-clock time) compared to RLVR. While RLVR eventually reaches a respectable reward level (~0.76), it takes nearly 7.5 hours to do so, a level that ERL surpasses in under 4 hours.
* **Practical Implication:** For applications where training time is a constraint, ERL is the clearly preferable approach based on this data. The ablation study (`w/o Mem.`, `w/o Refl.`) effectively isolates and validates the contribution of each architectural innovation within the ERL framework.
* **Anomaly/Note:** The final downturn in the RLVR curve could indicate instability in late-stage training or overfitting, a behavior not observed in the ERL variants within this time window.