## Line Chart: Cross-Entropy vs. Percentage of Interleaved/Text
### Overview
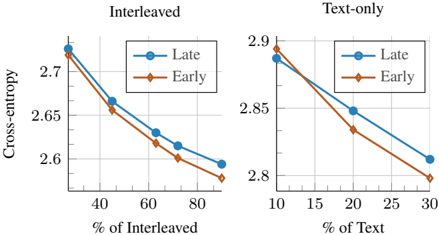
The image contains two line graphs comparing cross-entropy values for two methods ("Interleaved" and "Text-only") under two conditions ("Late" and "Early"). Cross-entropy is plotted on the y-axis against percentage values on the x-axis. Both graphs show downward trends, with "Early" consistently outperforming "Late" in terms of lower cross-entropy.
### Components/Axes
- **X-Axes**:
- **Interleaved**: Labeled "% of Interleaved" with markers at 40%, 60%, and 80%.
- **Text-only**: Labeled "% of Text" with markers at 10%, 15%, 20%, 25%, and 30%.
- **Y-Axis**: Labeled "Cross-entropy" with values ranging from 2.6 to 2.9.
- **Legends**:
- **Blue circles**: "Late" condition.
- **Orange diamonds**: "Early" condition.
- **Placement**: Legends are positioned to the right of each graph, with lines matching the legend colors.
### Detailed Analysis
#### Interleaved Graph
- **Late (Blue)**:
- Starts at ~2.75 at 40%.
- Decreases to ~2.6 at 80%.
- **Early (Orange)**:
- Starts at ~2.7 at 40%.
- Decreases to ~2.55 at 80%.
#### Text-only Graph
- **Late (Blue)**:
- Starts at ~2.85 at 10%.
- Decreases to ~2.8 at 30%.
- **Early (Orange)**:
- Starts at ~2.88 at 10%.
- Decreases to ~2.75 at 30%.
### Key Observations
1. **Downward Trends**: Both methods show cross-entropy decreasing as the percentage of interleaved/text increases.
2. **Performance Gap**: "Early" consistently achieves lower cross-entropy than "Late" in both methods.
3. **Steeper Decline in Interleaved**: The "Interleaved" graph exhibits a more pronounced slope compared to "Text-only."
4. **Higher Baseline in Text-only**: Cross-entropy values are generally higher in the "Text-only" method across all percentages.
### Interpretation
- **Cross-Entropy as Performance Metric**: Lower cross-entropy indicates better model performance. The "Early" condition outperforms "Late" in both methods, suggesting earlier processing or optimization yields better results.
- **Method Sensitivity**: The steeper decline in the "Interleaved" graph implies that increasing interleaved content has a more significant impact on reducing cross-entropy compared to text-only adjustments.
- **Text-only Limitations**: Higher cross-entropy values in the "Text-only" method may indicate inherent inefficiencies or greater sensitivity to input variability.
- **Practical Implications**: The data suggests that interleaving content (e.g., mixing text with other modalities) could be more effective for improving model performance, particularly when combined with the "Early" condition.