## Line Charts: Validation Loss and N/D vs FLOPs
### Overview
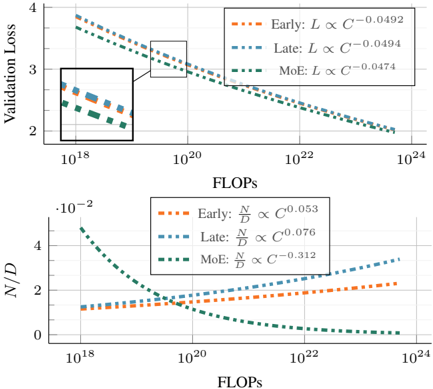
The image contains two vertically stacked line charts comparing the performance of three methods ("Early," "Late," "MoE") across computational scales (FLOPs). The top chart shows **Validation Loss**, while the bottom chart shows **N/D** (likely a normalized metric like accuracy or efficiency). Both charts use logarithmic scales for FLOPs (10¹⁸ to 10²⁴) and linear scales for their respective y-axes.
---
### Components/Axes
#### Top Chart: Validation Loss
- **X-axis**: FLOPs (log scale, 10¹⁸ to 10²⁴)
- **Y-axis**: Validation Loss (linear scale, 2 to 4)
- **Legend**:
- Orange dotted: Early (L ∝ C⁻⁰·⁰⁴⁹²)
- Blue dashed: Late (L ∝ C⁻⁰·⁰⁴⁷⁴)
- Green dash-dotted: MoE (L ∝ C⁻⁰·⁰⁴⁷⁴)
- **Inset**: Zoomed-in view of the lower FLOPs range (10¹⁸–10²⁰) to highlight convergence.
#### Bottom Chart: N/D
- **X-axis**: FLOPs (log scale, 10¹⁸ to 10²⁴)
- **Y-axis**: N/D (linear scale, 0 to 4)
- **Legend**:
- Orange dotted: Early (N/D ∝ C⁰·⁰⁵³)
- Blue dashed: Late (N/D ∝ C⁰·⁰⁷⁶)
- Green dash-dotted: MoE (N/D ∝ C⁻⁰·³¹²)
---
### Detailed Analysis
#### Top Chart: Validation Loss
- **Trends**:
- All three methods show **decreasing validation loss** as FLOPs increase.
- **Early** (orange) has the steepest slope (C⁻⁰·⁰⁴⁹²), indicating faster loss reduction.
- **Late** (blue) and **MoE** (green) have nearly identical slopes (C⁻⁰·⁰⁴⁷⁴), suggesting similar efficiency at higher FLOPs.
- The inset reveals that at lower FLOPs (10¹⁸–10²⁰), all lines converge, implying comparable performance in resource-constrained regimes.
#### Bottom Chart: N/D
- **Trends**:
- **Early** (orange) and **Late** (blue) show **increasing N/D** with FLOPs, with Late having a steeper slope (C⁰·⁰⁷⁶ vs. C⁰·⁰⁵³).
- **MoE** (green) exhibits a **decreasing N/D** trend (C⁻⁰·³¹²), indicating a trade-off between computational cost and this metric.
- At 10²⁴ FLOPs, MoE’s N/D drops below 1, while Early/Late remain above 2.
---
### Key Observations
1. **Validation Loss**: All methods improve with scale, but MoE and Late plateau at similar loss levels.
2. **N/D Divergence**: MoE’s N/D decreases sharply, contrasting with Early/Late’s gains. This suggests MoE may prioritize efficiency over this metric.
3. **Convergence at Low FLOPs**: The inset highlights that methods perform similarly when computational resources are limited.
---
### Interpretation
- **Validation Loss**: The similar slopes of Late and MoE suggest they scale comparably in reducing error, while Early is more aggressive. This could imply architectural trade-offs (e.g., MoE’s sparsity vs. Late’s timing).
- **N/D Trade-offs**: MoE’s declining N/D at high FLOPs hints at diminishing returns or conflicting objectives (e.g., accuracy vs. efficiency). Early and Late’s rising N/D align with their validation loss trends, suggesting a positive correlation between this metric and performance.
- **Practical Implications**: At scale (10²⁰+ FLOPs), Early and Late outperform MoE in N/D, but MoE may be preferable in low-resource settings where validation loss convergence is critical.
---
### Spatial Grounding & Verification
- **Legend Alignment**: Colors and line styles match across both charts (e.g., orange dotted = Early in both).
- **Trend Consistency**: Slopes in the top chart (negative exponents) align with decreasing loss, while bottom chart slopes (positive/negative exponents) match N/D trends.
- **Inset Placement**: The zoomed-in view is centered on the lower-left corner of the top chart, emphasizing low-FLOP behavior.
---
### Content Details
- **Equations**:
- Top: L ∝ C⁻⁰·⁰⁴⁹² (Early), C⁻⁰·⁰⁴⁷⁴ (Late/MoE)
- Bottom: N/D ∝ C⁰·⁰⁵³ (Early), C⁰·⁰⁷⁶ (Late), C⁻⁰·³¹² (MoE)
- **Axis Ranges**:
- FLOPs: 10¹⁸–10²⁴ (log scale)
- Validation Loss: 2–4
- N/D: 0–4
---
### Final Notes
The charts highlight a computational efficiency trade-off: Early and Late methods improve both validation loss and N/D with scale, while MoE sacrifices N/D for competitive loss reduction. The inset underscores the importance of FLOP budget in method selection.