## Flowchart: Causal Relationship Diagram
### Overview
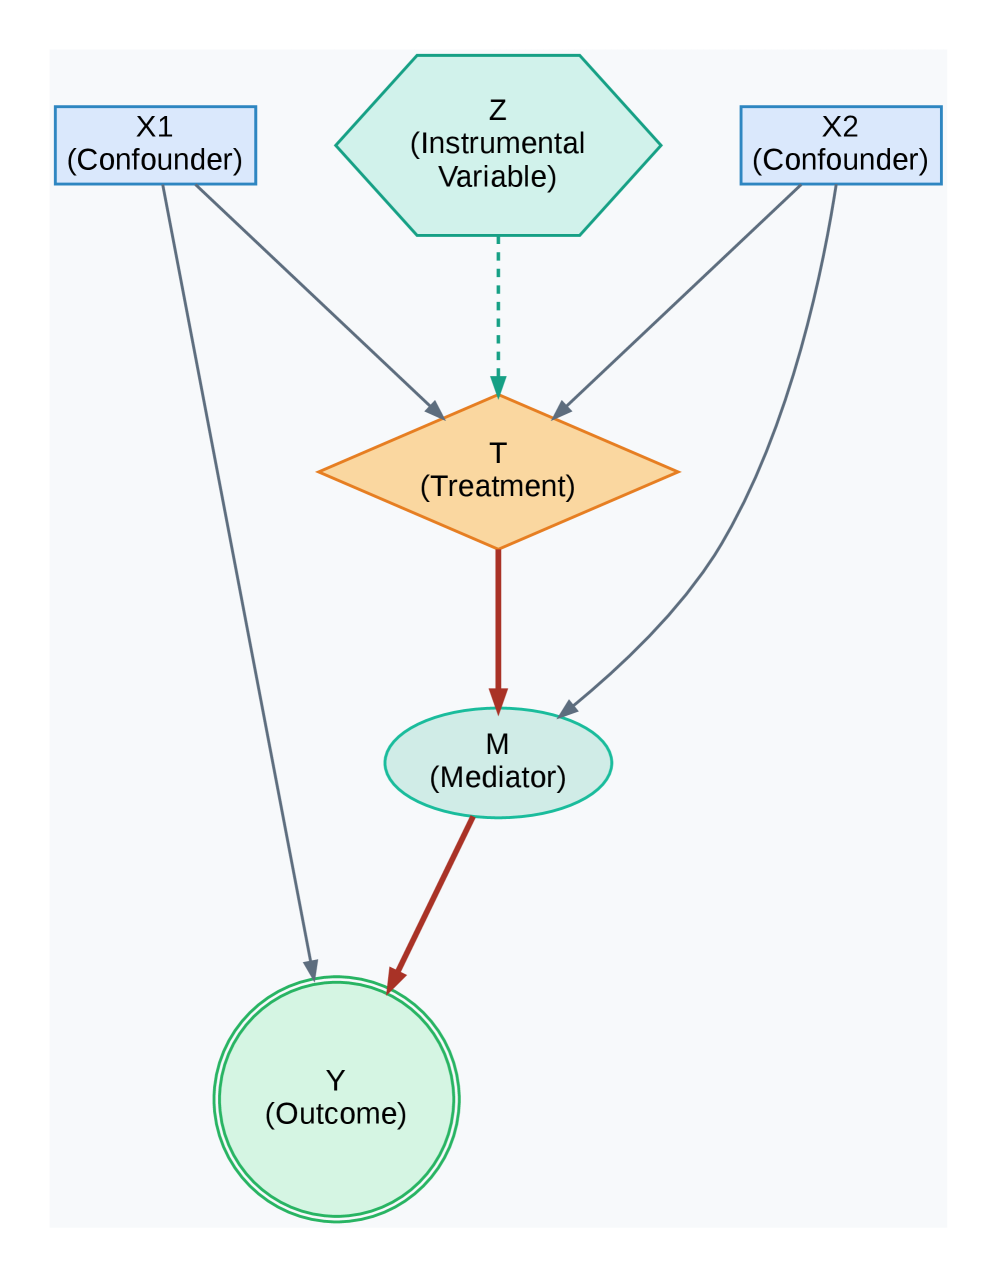
The image depicts a causal relationship diagram illustrating interactions between variables in a statistical or epidemiological model. It includes confounders, an instrumental variable, treatment, mediator, and outcome, with directional arrows indicating influence.
### Components/Axes
- **Nodes**:
- **X1 (Confounder)**: Blue rectangle, positioned top-left.
- **X2 (Confounder)**: Blue rectangle, positioned top-right.
- **Z (Instrumental Variable)**: Green hexagon, centered at the top.
- **T (Treatment)**: Orange diamond, central node.
- **M (Mediator)**: Green oval, below T.
- **Y (Outcome)**: Light green circle, bottom-center.
- **Edges**:
- Solid arrows (dark gray) indicate direct causal relationships.
- Dashed arrow (light gray) from Z to T denotes indirect or instrumental influence.
- Red arrows highlight primary pathways (e.g., T → M → Y).
### Detailed Analysis
1. **Confounders (X1, X2)**:
- Both X1 and X2 directly influence T (treatment) and Y (outcome).
- No direct connection between X1 and X2.
2. **Instrumental Variable (Z)**:
- Z affects T via a dashed arrow, suggesting it modifies treatment assignment without directly impacting Y.
3. **Treatment (T)**:
- T influences M (mediator) via a solid red arrow.
- T also has a direct effect on Y (solid red arrow).
4. **Mediator (M)**:
- M is influenced by T and directly affects Y.
5. **Outcome (Y)**:
- Y receives inputs from T, M, X1, and X2.
### Key Observations
- **Confounding Bias**: X1 and X2 create bidirectional pathways to Y, indicating potential confounding effects.
- **Mediation Pathway**: T → M → Y represents a mediated effect of treatment on outcome.
- **Instrumental Variable Role**: Z’s dashed arrow to T implies it isolates exogenous variation in treatment, reducing confounding bias.
- **Direct Effects**: T and M both directly impact Y, suggesting partial mediation.
### Interpretation
This diagram models a causal pathway where confounders (X1, X2) influence both treatment (T) and outcome (Y), creating potential bias. The instrumental variable (Z) is used to address this by affecting T without directly influencing Y. The mediator (M) explains part of T’s effect on Y, while T also has a direct effect. The red arrows emphasize the primary causal chain (T → M → Y), while gray arrows show secondary relationships. This structure is typical in studies aiming to disentangle direct and indirect effects while controlling for confounding variables.