```markdown
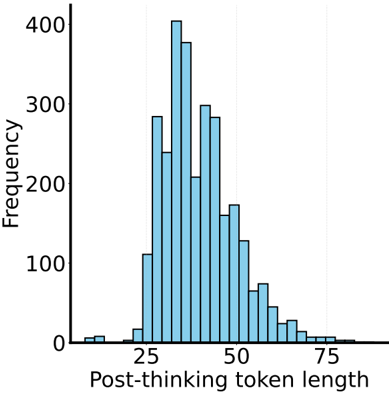
## Bar Chart: Post-thinking token length distribution
### Overview
The chart displays a frequency distribution of post-thinking token lengths, showing a bell-shaped curve with the highest frequency at token length 30. Frequencies decrease symmetrically on both sides of the peak, with minimal values at the extremes (25 and 75).
### Components/Axes
- **X-axis**: "Post-thinking token length" (integer values from 25 to 75 in increments of 5)
- **Y-axis**: "Frequency" (linear scale from 0 to 400)
- **Bars**: Blue vertical bars representing frequency counts
- **Title**: "Post-thinking token length distribution" (top center)
- **Gridlines**: Vertical dashed lines at each x-axis tick
### Detailed Analysis
- **Peak frequency**: ~400 occurrences at token length 30
- **Secondary peaks**:
- 35: ~380
- 40: ~300
- 45: ~250
- **Decline pattern**:
- 50: ~180
- 55: ~120
- 60: ~80
- 65: ~40
- 70: ~20
- **Extreme values**:
- 25: ~5
- 75: ~3
### Key Observations
1. **Symmetrical distribution**: Frequencies mirror each other around the 30-40 range
2. **Rapid decline**: 70% of frequencies occur between token lengths 25-50
3. **Long tail**: Frequencies drop below 20 for lengths >70
4. **Modality**: Single dominant peak at 30 with no secondary modes
### Interpretation
The data suggests an optimal post-thinking token length cluster around 30-40 characters, with system performance or user preference sharply decreasing for both shorter and longer lengths. The symmetrical decline implies a potential normal distribution pattern, possibly indicating:
- Cognitive load