## Line Graph: Model Performance vs. Computational Resources
### Overview
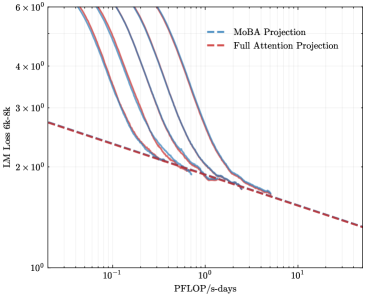
The image depicts a logarithmic-scale line graph comparing two computational efficiency projections: "MoBA Projection" (blue dashed line) and "Full Attention Projection" (red dashed line). The graph illustrates how model loss (LM Loss 6k-8k) decreases as computational resources (PFlOP/s-days) increase. Both lines exhibit exponential decay trends, with the MoBA Projection initially outperforming but converging with the Full Attention Projection at higher resource levels.
### Components/Axes
- **X-axis (PFlOP/s-days)**: Logarithmic scale ranging from 10⁻¹ to 10¹, with gridlines at 10⁻¹, 10⁰, and 10¹.
- **Y-axis (LM Loss 6k-8k)**: Logarithmic scale from 10⁰ to 6×10⁰, with gridlines at 10⁰, 2×10⁰, 3×10⁰, 4×10⁰, 5×10⁰, and 6×10⁰.
- **Legend**: Located in the top-right corner, associating:
- Blue dashed line → MoBA Projection
- Red dashed line → Full Attention Projection
### Detailed Analysis
1. **MoBA Projection (Blue Dashed Line)**:
- Starts at ~6×10⁰ loss when PFlOP/s-days = 10⁻¹.
- Declines steeply, reaching ~2×10⁰ loss at PFlOP/s-days = 10⁰.
- Continues to decrease gradually, ending near ~1.5×10⁰ at PFlOP/s-days = 10¹.
2. **Full Attention Projection (Red Dashed Line)**:
- Begins at ~5×10⁰ loss at PFlOP/s-days = 10⁻¹.
- Decreases more gradually than MoBA, intersecting the MoBA line at ~2×10⁰ loss (PFlOP/s-days ≈ 10⁰).
- After intersection, declines more sharply, ending near ~1.2×10⁰ at PFlOP/s-days = 10¹.
### Key Observations
- **Convergence Point**: Both lines intersect at ~2×10⁰ loss (PFlOP/s-days ≈ 10⁰), suggesting equivalent performance at this resource level.
- **Efficiency Tradeoff**: MoBA Projection requires fewer resources to achieve similar loss reduction initially, while Full Attention Projection becomes more efficient at higher resource levels.
- **Asymptotic Behavior**: Both lines approach lower loss values as PFlOP/s-days increase, but Full Attention Projection demonstrates a steeper decline post-convergence.
### Interpretation
The graph highlights a tradeoff between computational efficiency and model performance. MoBA Projection offers better initial efficiency, achieving lower loss with fewer resources. However, Full Attention Projection becomes more effective at higher computational scales, suggesting it may be preferable for resource-intensive applications. The convergence at 10⁰ PFlOP/s-days implies a critical threshold where Full Attention's architectural advantages (e.g., attention mechanisms) outweigh MoBA's initial efficiency. This could inform hardware-software co-design decisions, where resource allocation strategies depend on the target performance regime.