\n
## Scatter Plot: Confidence vs. Target Length (college_chemistry)
### Overview
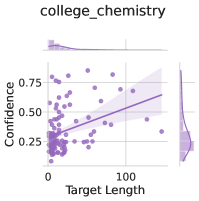
This image presents a scatter plot visualizing the relationship between "Target Length" and "Confidence" for a dataset labeled "college_chemistry". A regression line with a shaded confidence interval is overlaid on the scatter points. The plot also includes marginal distributions (histograms) along the top and right edges, showing the distributions of "Target Length" and "Confidence" respectively.
### Components/Axes
* **Title:** "college\_chemistry" (top-center)
* **X-axis:** "Target Length" (bottom-center), ranging from approximately 0 to 120.
* **Y-axis:** "Confidence" (left-center), ranging from approximately 0.2 to 0.8.
* **Scatter Points:** Purple dots representing individual data points.
* **Regression Line:** A purple line representing the trend of the data. The line slopes upwards.
* **Confidence Interval:** A shaded purple area around the regression line, indicating the uncertainty in the estimated trend.
* **Marginal Distribution (Top):** A histogram showing the distribution of "Target Length".
* **Marginal Distribution (Right):** A histogram showing the distribution of "Confidence".
### Detailed Analysis
The scatter plot shows a positive correlation between "Target Length" and "Confidence". As "Target Length" increases, "Confidence" tends to increase as well, though the relationship is not strong.
* **Scatter Points:** The points are clustered around the x-axis for low "Target Length" values, with "Confidence" values generally between 0.2 and 0.4. As "Target Length" increases, the points become more dispersed, with "Confidence" values ranging from approximately 0.3 to 0.75.
* **Regression Line:** The regression line has a positive slope, indicating a positive correlation. The line starts at approximately (0, 0.3) and ends at approximately (120, 0.6).
* **Confidence Interval:** The confidence interval is wider for larger "Target Length" values, indicating greater uncertainty in the estimated "Confidence" for longer target lengths.
* **Marginal Distribution (Target Length):** The distribution of "Target Length" is skewed to the right, with a peak around 0 and a long tail extending to higher values.
* **Marginal Distribution (Confidence):** The distribution of "Confidence" appears to be roughly symmetrical, with a peak around 0.4.
Approximate Data Points (sampled from the plot):
| Target Length | Confidence |
|---|---|
| 0 | 0.25 |
| 10 | 0.35 |
| 20 | 0.45 |
| 30 | 0.50 |
| 40 | 0.55 |
| 50 | 0.60 |
| 60 | 0.65 |
| 70 | 0.70 |
| 80 | 0.70 |
| 90 | 0.70 |
| 100 | 0.70 |
| 110 | 0.60 |
| 120 | 0.55 |
### Key Observations
* The positive correlation between "Target Length" and "Confidence" is visually apparent.
* The confidence interval widens as "Target Length" increases, suggesting that the relationship between the two variables becomes less certain for longer target lengths.
* The marginal distributions provide insights into the distributions of each variable independently.
### Interpretation
The data suggests that, in the context of "college\_chemistry", there is a tendency for higher confidence levels to be associated with longer target lengths. However, the relationship is not strong, and there is considerable variability in confidence levels for a given target length. The widening confidence interval indicates that the predictive power of "Target Length" on "Confidence" diminishes as "Target Length" increases. This could be due to other factors influencing confidence levels that are not captured in this simple bivariate analysis. The skewed distribution of "Target Length" suggests that shorter target lengths are more common in this dataset. The marginal distributions provide a baseline understanding of the range and typical values for each variable.