## Chart: Contrast vs. Frequency
### Overview
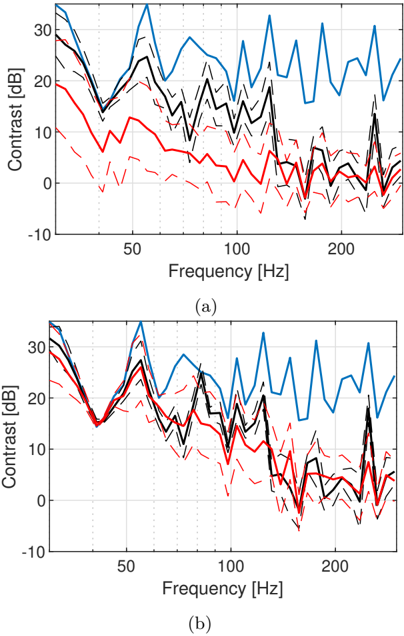
The image presents two line charts, (a) and (b), each displaying the relationship between "Contrast [dB]" on the y-axis and "Frequency [Hz]" on the x-axis. Each chart contains four data series: a blue line, a red line, a black line, and two black dashed lines. The black line appears to represent the mean, while the dashed lines likely represent the standard deviation or confidence interval around the mean. The red and blue lines represent different conditions or data sets.
### Components/Axes
* **Y-axis (Contrast):** Labeled "Contrast [dB]", ranges from -10 to 30 with tick marks at -10, 0, 10, 20, and 30.
* **X-axis (Frequency):** Labeled "Frequency [Hz]", ranges from approximately 25 to 250 with tick marks at 50, 100, and 200.
* **Data Series:**
* Blue Line: Represents one condition or data set.
* Red Line: Represents another condition or data set.
* Black Line (solid): Represents the mean.
* Black Dashed Lines: Represent the standard deviation or confidence interval.
* **Subplot Labels:** (a) and (b) are placed below their respective charts.
### Detailed Analysis
**Chart (a):**
* **Blue Line:** Starts at approximately 32 dB at 25 Hz. It decreases to approximately 17 dB at 40 Hz, then increases sharply with high frequency oscillations, reaching peaks around 35 dB.
* **Red Line:** Starts at approximately 20 dB at 25 Hz. It decreases to approximately 2 dB at 180 Hz, then increases slightly to approximately 3 dB at 250 Hz.
* **Black Line (Mean):** Starts at approximately 28 dB at 25 Hz. It decreases to approximately 2 dB at 180 Hz, then increases slightly to approximately 3 dB at 250 Hz.
* **Black Dashed Lines (Standard Deviation):** The dashed lines are positioned above and below the black mean line, indicating the variability in the data.
**Chart (b):**
* **Blue Line:** Starts at approximately 30 dB at 25 Hz. It decreases to approximately 15 dB at 40 Hz, then increases sharply with high frequency oscillations, reaching peaks around 35 dB.
* **Red Line:** Starts at approximately 27 dB at 25 Hz. It decreases to approximately 12 dB at 40 Hz, then decreases to approximately 2 dB at 180 Hz, then increases slightly to approximately 3 dB at 250 Hz.
* **Black Line (Mean):** Starts at approximately 29 dB at 25 Hz. It decreases to approximately 12 dB at 40 Hz, then decreases to approximately 2 dB at 180 Hz, then increases slightly to approximately 3 dB at 250 Hz.
* **Black Dashed Lines (Standard Deviation):** The dashed lines are positioned above and below the black mean line, indicating the variability in the data.
### Key Observations
* The blue line consistently exhibits higher contrast values, especially at higher frequencies, compared to the red line in both charts.
* The red line and the black line (mean) are very similar in both charts.
* The dashed lines indicate a wider spread of data at lower frequencies, suggesting greater variability in that region.
* The two charts (a) and (b) show similar trends for all data series, but the red line in chart (b) starts at a higher contrast value than in chart (a).
### Interpretation
The charts compare the contrast levels at different frequencies for two conditions represented by the blue and red lines. The blue line shows a higher contrast, especially at higher frequencies, suggesting that the condition it represents is more responsive or has a stronger signal at those frequencies. The red line shows a lower contrast, indicating a weaker signal or response. The black line represents the average contrast, and the dashed lines show the variability around that average. The similarity between the red line and the black line suggests that the red line condition is closer to the average. The differences between charts (a) and (b), particularly in the starting point of the red line, suggest that there might be slight variations in the experimental setup or conditions between the two measurements. Overall, the data suggests that the blue line condition is significantly different from the red line condition in terms of contrast response across the frequency spectrum.