\n
## Line Chart: Training Accuracy
### Overview
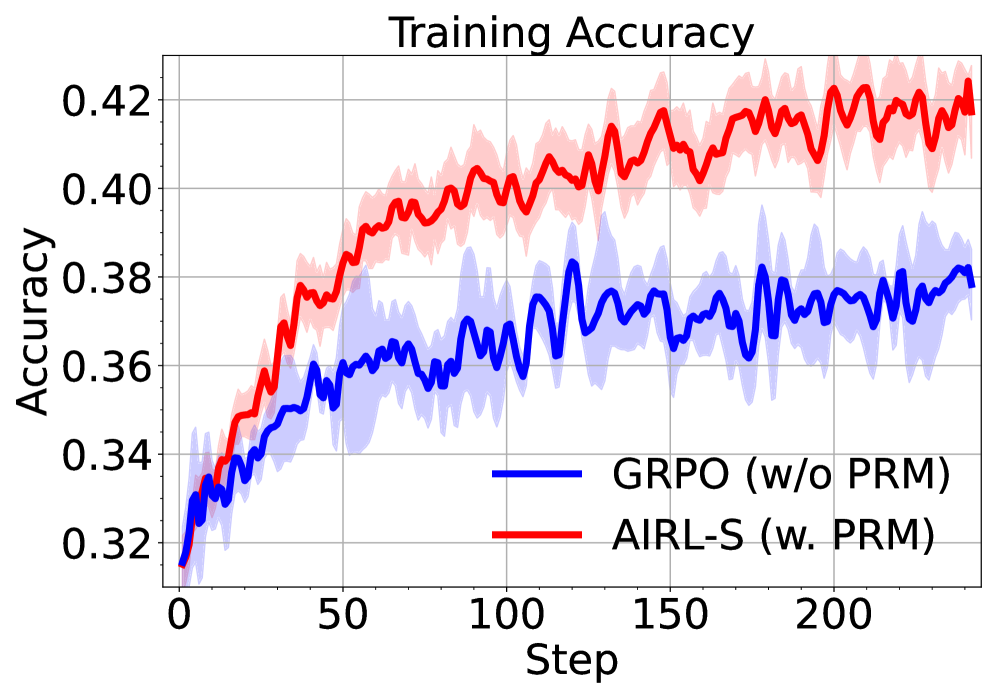
This line chart displays the training accuracy of two different models, GRPO (without PRM) and AIRL-S (with PRM), over a series of training steps. The chart shows the mean accuracy for each model, along with a shaded region representing the standard deviation around the mean.
### Components/Axes
* **Title:** "Training Accuracy" - positioned at the top-center of the chart.
* **X-axis:** "Step" - ranging from approximately 0 to 220, with tick marks at intervals of 50.
* **Y-axis:** "Accuracy" - ranging from approximately 0.32 to 0.42, with tick marks at intervals of 0.02.
* **Legend:** Located in the bottom-center of the chart.
* **Blue Line:** "GRPO (w/o PRM)"
* **Red Line:** "AIRL-S (w. PRM)"
* **Shaded Regions:** Light blue around the blue line, and light red around the red line, representing the standard deviation.
### Detailed Analysis
**AIRL-S (w. PRM) - Red Line:**
The red line representing AIRL-S shows an upward trend throughout the training process.
* At Step 0, the accuracy is approximately 0.33.
* At Step 50, the accuracy is approximately 0.39.
* At Step 100, the accuracy is approximately 0.40.
* At Step 150, the accuracy is approximately 0.41.
* At Step 200, the accuracy is approximately 0.41.
* At Step 220, the accuracy is approximately 0.41.
The shaded region around the red line indicates a relatively consistent standard deviation, ranging from approximately 0.01 to 0.02.
**GRPO (w/o PRM) - Blue Line:**
The blue line representing GRPO shows a more fluctuating trend, with periods of increase and decrease.
* At Step 0, the accuracy is approximately 0.33.
* At Step 50, the accuracy is approximately 0.36.
* At Step 100, the accuracy is approximately 0.37.
* At Step 150, the accuracy is approximately 0.37.
* At Step 200, the accuracy is approximately 0.38.
* At Step 220, the accuracy is approximately 0.38.
The shaded region around the blue line indicates a larger and more variable standard deviation, ranging from approximately 0.01 to 0.03.
### Key Observations
* AIRL-S consistently outperforms GRPO in terms of training accuracy.
* The standard deviation of AIRL-S is smaller than that of GRPO, indicating more stable training.
* GRPO exhibits more volatility in its training accuracy, suggesting it may be more sensitive to variations in the training data or hyperparameters.
* Both models appear to converge towards a stable accuracy level after approximately 150 steps.
### Interpretation
The data suggests that incorporating PRM (as in AIRL-S) leads to improved and more stable training accuracy compared to not using PRM (as in GRPO). The consistent upward trend and smaller standard deviation of AIRL-S indicate that it learns more effectively and is less prone to overfitting or instability during training. The fluctuating behavior of GRPO suggests that it may require more careful tuning or regularization to achieve comparable performance. The convergence of both models after 150 steps implies that the training process is reaching a point of diminishing returns, and further training may not yield significant improvements in accuracy. The difference in performance between the two models highlights the importance of the PRM component in achieving optimal results.