## Charts: Accuracy (ACC) and Expected Calibration Error (ECE) vs. Layer Index
### Overview
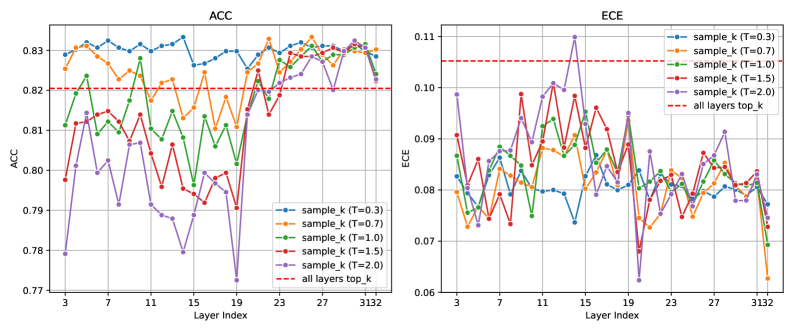
The image presents two line charts side-by-side. The left chart displays Accuracy (ACC) against Layer Index, while the right chart shows Expected Calibration Error (ECE) against Layer Index. Both charts compare the performance of different temperature (T) settings for a 'sample_k' method, as well as an 'all layers top_k' method. Each chart has a similar x-axis (Layer Index) and uses color-coded lines to represent different temperature values.
### Components/Axes
**Left Chart (ACC):**
* **Title:** ACC
* **X-axis:** Layer Index (ranging from approximately 1 to 3132, with markers at 1, 3, 7, 11, 15, 19, 23, 27, and 3132)
* **Y-axis:** ACC (ranging from approximately 0.77 to 0.83, with markers at 0.77, 0.79, 0.80, 0.81, 0.82, and 0.83)
* **Legend:** Located at the bottom-right. Contains the following entries with corresponding colors:
* sample\_k (T=0.3) - Blue
* sample\_k (T=0.7) - Orange
* sample\_k (T=1.0) - Green
* sample\_k (T=1.5) - Purple
* sample\_k (T=2.0) - Brown
* all layers top\_k - Red (dashed line)
**Right Chart (ECE):**
* **Title:** ECE
* **X-axis:** Layer Index (ranging from approximately 1 to 3132, with markers at 1, 3, 7, 11, 15, 19, 23, 27, and 3132)
* **Y-axis:** ECE (ranging from approximately 0.06 to 0.11, with markers at 0.06, 0.07, 0.08, 0.09, 0.10, and 0.11)
* **Legend:** Located at the bottom-right. Contains the same entries and colors as the left chart.
### Detailed Analysis or Content Details
**Left Chart (ACC):**
* **sample\_k (T=0.3) - Blue:** Starts at approximately 0.828, fluctuates around 0.82-0.83, dips to around 0.78 at layer index 19, and recovers to approximately 0.825 by layer index 3132.
* **sample\_k (T=0.7) - Orange:** Starts at approximately 0.832, generally declines to around 0.815 by layer index 11, then fluctuates between 0.815 and 0.83, ending at approximately 0.828.
* **sample\_k (T=1.0) - Green:** Starts at approximately 0.815, increases to around 0.825 by layer index 3, then fluctuates significantly, reaching a low of approximately 0.79 at layer index 19, and ending at approximately 0.82.
* **sample\_k (T=1.5) - Purple:** Starts at approximately 0.805, increases to around 0.82 by layer index 3, then declines to approximately 0.77 at layer index 19, and recovers to approximately 0.81 by layer index 3132.
* **sample\_k (T=2.0) - Brown:** Starts at approximately 0.795, increases to around 0.81 by layer index 3, then fluctuates, reaching a low of approximately 0.77 at layer index 19, and ending at approximately 0.80.
* **all layers top\_k - Red:** Starts at approximately 0.815, fluctuates around 0.82-0.83, with a slight dip around layer index 15, and ends at approximately 0.828.
**Right Chart (ECE):**
* **sample\_k (T=0.3) - Blue:** Starts at approximately 0.085, fluctuates around 0.075-0.09, with a peak around layer index 15, and ends at approximately 0.08.
* **sample\_k (T=0.7) - Orange:** Starts at approximately 0.078, fluctuates around 0.07-0.085, with a peak around layer index 15, and ends at approximately 0.078.
* **sample\_k (T=1.0) - Green:** Starts at approximately 0.08, fluctuates around 0.07-0.09, with a peak around layer index 15, and ends at approximately 0.08.
* **sample\_k (T=1.5) - Purple:** Starts at approximately 0.085, fluctuates around 0.075-0.095, with a peak around layer index 15, and ends at approximately 0.085.
* **sample\_k (T=2.0) - Brown:** Starts at approximately 0.08, fluctuates around 0.07-0.09, with a peak around layer index 15, and ends at approximately 0.08.
* **all layers top\_k - Red:** Starts at approximately 0.095, fluctuates around 0.085-0.105, with a peak around layer index 15, and ends at approximately 0.09.
### Key Observations
* The ACC chart shows that the 'sample\_k' method with T=0.7 generally achieves the highest accuracy, while T=2.0 consistently has the lowest accuracy.
* The ECE chart shows that the 'all layers top\_k' method generally has the highest ECE, indicating poorer calibration.
* Both charts exhibit a noticeable fluctuation around layer index 15, suggesting a potential change in the model's behavior at that layer.
* The ECE values are relatively stable across different temperature settings for the 'sample\_k' method.
### Interpretation
The charts demonstrate the trade-off between accuracy and calibration when using different temperature settings with the 'sample\_k' method. Higher temperatures (T=1.5 and T=2.0) lead to lower accuracy, while lower temperatures (T=0.3 and T=0.7) maintain higher accuracy. The 'all layers top\_k' method, while achieving comparable accuracy to some of the 'sample\_k' methods, exhibits poorer calibration, as indicated by the higher ECE values. The fluctuation around layer index 15 could indicate a critical layer where the model's confidence is particularly sensitive to the temperature setting. The data suggests that a temperature of 0.7 provides a good balance between accuracy and calibration for the 'sample\_k' method. The consistent higher ECE for 'all layers top\_k' suggests it may be overconfident in its predictions.