# Technical Document Extraction: Compute Optimal Search Chart
## 1. Metadata and Header Information
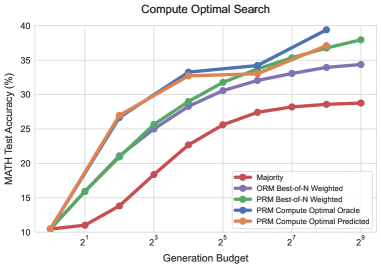
* **Title:** Compute Optimal Search
* **Language:** English (100%)
* **Image Type:** Line Graph with markers
* **Primary Subject:** Performance comparison of different search/ranking methods for mathematical problem solving across varying computational budgets.
## 2. Axis and Scale Identification
* **Y-Axis (Vertical):**
* **Label:** MATH Test Accuracy (%)
* **Range:** 10 to 40
* **Markers:** 10, 15, 20, 25, 30, 35, 40
* **X-Axis (Horizontal):**
* **Label:** Generation Budget
* **Scale:** Logarithmic (Base 2)
* **Markers:** $2^1, 2^3, 2^5, 2^7, 2^9$ (with intermediate grid lines representing $2^0, 2^2, 2^4, 2^6, 2^8$)
## 3. Legend and Component Isolation
The legend is located in the bottom-right quadrant of the main chart area.
| Legend Label | Color | Marker Style |
| :--- | :--- | :--- |
| **Majority** | Red | Solid line with circle |
| **ORM Best-of-N Weighted** | Purple | Solid line with circle |
| **PRM Best-of-N Weighted** | Green | Solid line with circle |
| **PRM Compute Optimal Oracle** | Blue | Solid line with circle |
| **PRM Compute Optimal Predicted** | Orange | Solid line with circle |
## 4. Trend Verification and Data Extraction
All data series exhibit a positive correlation: as the "Generation Budget" increases, the "MATH Test Accuracy (%)" also increases, though most series show diminishing returns at higher budgets.
### Data Series Analysis
#### A. Majority (Red Line)
* **Trend:** The lowest performing baseline. It shows a steady, nearly linear increase on the log scale but remains significantly below all other methods.
* **Approximate Data Points:**
* $2^0$: ~10.5%
* $2^2$: ~14%
* $2^4$: ~23%
* $2^9$: ~29%
#### B. ORM Best-of-N Weighted (Purple Line)
* **Trend:** Slopes upward sharply until $2^4$, then decelerates, ending as the second-lowest performer at high budgets.
* **Approximate Data Points:**
* $2^0$: ~10.5%
* $2^4$: ~28%
* $2^9$: ~34.5%
#### C. PRM Best-of-N Weighted (Green Line)
* **Trend:** Consistently outperforms the ORM and Majority baselines. It maintains a steady upward trajectory throughout the budget range.
* **Approximate Data Points:**
* $2^0$: ~10.5%
* $2^4$: ~29%
* $2^9$: ~38%
#### D. PRM Compute Optimal Oracle (Blue Line)
* **Trend:** The highest performing series. It shows a very steep initial climb and reaches the highest recorded accuracy (~39.5%) at a budget of $2^8$. Note: This line ends at $2^8$.
* **Approximate Data Points:**
* $2^0$: ~10.5%
* $2^2$: ~27%
* $2^4$: ~33.5%
* $2^8$: ~39.5%
#### E. PRM Compute Optimal Predicted (Orange Line)
* **Trend:** Closely tracks the "Oracle" (Blue) line at lower budgets ($2^0$ to $2^4$). Between $2^4$ and $2^8$, it plateaus significantly compared to the Oracle, eventually converging with the PRM Best-of-N Weighted (Green) line.
* **Approximate Data Points:**
* $2^0$: ~10.5%
* $2^2$: ~27%
* $2^4$: ~33%
* $2^8$: ~37%
## 5. Summary of Findings
The chart demonstrates that Process-based Reward Models (PRM) significantly outperform Outcome-based Reward Models (ORM) and simple Majority voting. The "Compute Optimal Oracle" suggests that with perfect selection, accuracy can reach nearly 40% within a $2^8$ budget. The "Predicted" model successfully mimics the Oracle at low budgets but loses its competitive edge as the budget exceeds $2^4$, falling back toward the standard PRM weighted performance.