## Line Chart: Neural Architecture Search Performance
### Overview
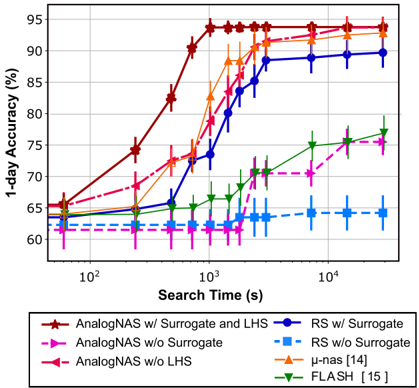
This image presents a line chart comparing the performance of different Neural Architecture Search (NAS) algorithms based on their search time and resulting 1-day accuracy. The chart displays accuracy as a function of search time, with error bars indicating the variance in performance.
### Components/Axes
* **X-axis:** Search Time (s), displayed on a logarithmic scale (10<sup>2</sup> to 10<sup>4</sup>).
* **Y-axis:** 1-day Accuracy (%), ranging from approximately 60% to 95%.
* **Legend:** Located at the bottom of the chart, identifying the different NAS algorithms:
* AnalogNAS w/ Surrogate and LHS (Dark Red)
* AnalogNAS w/o Surrogate (Red)
* AnalogNAS w/o LHS (Magenta)
* RS w/ Surrogate (Dark Blue)
* RS w/o Surrogate (Blue)
* μ-nas [14] (Orange)
* FLASH [15] (Green)
* **Error Bars:** Vertical lines extending above and below each data point, representing the standard deviation or confidence interval.
* **Gridlines:** Horizontal and vertical lines providing a visual reference for data point values.
### Detailed Analysis
The chart shows the following trends and approximate data points:
* **AnalogNAS w/ Surrogate and LHS (Dark Red):** This line starts at approximately 65% accuracy at 10<sup>2</sup> seconds, rapidly increases to around 93% accuracy at 10<sup>3</sup> seconds, and plateaus around 95% accuracy at 10<sup>4</sup> seconds.
* **AnalogNAS w/o Surrogate (Red):** This line begins at approximately 65% accuracy at 10<sup>2</sup> seconds, increases to around 92% accuracy at 10<sup>3</sup> seconds, and plateaus around 94% accuracy at 10<sup>4</sup> seconds.
* **AnalogNAS w/o LHS (Magenta):** This line starts at approximately 62% accuracy at 10<sup>2</sup> seconds, increases to around 88% accuracy at 10<sup>3</sup> seconds, and plateaus around 92% accuracy at 10<sup>4</sup> seconds.
* **RS w/ Surrogate (Dark Blue):** This line starts at approximately 65% accuracy at 10<sup>2</sup> seconds, increases to around 90% accuracy at 10<sup>3</sup> seconds, and plateaus around 91% accuracy at 10<sup>4</sup> seconds.
* **RS w/o Surrogate (Blue):** This line remains relatively flat, starting at approximately 63% accuracy at 10<sup>2</sup> seconds and ending around 65% accuracy at 10<sup>4</sup> seconds.
* **μ-nas [14] (Orange):** This line starts at approximately 63% accuracy at 10<sup>2</sup> seconds, increases to around 72% accuracy at 10<sup>3</sup> seconds, and reaches approximately 75% accuracy at 10<sup>4</sup> seconds.
* **FLASH [15] (Green):** This line starts at approximately 63% accuracy at 10<sup>2</sup> seconds, increases to around 73% accuracy at 10<sup>3</sup> seconds, and reaches approximately 77% accuracy at 10<sup>4</sup> seconds.
### Key Observations
* The AnalogNAS algorithms (especially with both Surrogate and LHS) demonstrate the fastest improvement in accuracy with increasing search time.
* RS w/ Surrogate performs better than RS w/o Surrogate, indicating the benefit of using a surrogate model.
* μ-nas [14] and FLASH [15] exhibit significantly lower accuracy compared to the AnalogNAS and RS algorithms, even with longer search times.
* RS w/o Surrogate shows minimal improvement in accuracy with increasing search time.
* The error bars suggest that the AnalogNAS algorithms have relatively low variance in performance.
### Interpretation
The data suggests that the AnalogNAS algorithms are highly effective in finding high-accuracy neural architectures within a reasonable search time. The inclusion of both a surrogate model and LHS (Latin Hypercube Sampling) further enhances the performance of AnalogNAS. The relatively poor performance of μ-nas [14] and FLASH [15] indicates that these algorithms may be less efficient or require significantly more search time to achieve comparable accuracy. The flat line for RS w/o Surrogate suggests that the surrogate model is crucial for the performance of this algorithm. The logarithmic scale of the x-axis highlights the rapid gains in accuracy achieved by AnalogNAS within the initial search time, indicating a potentially efficient exploration of the architecture space. The error bars provide a measure of the robustness of each algorithm, with AnalogNAS showing consistent performance. This chart provides a comparative analysis of different NAS algorithms, offering insights into their strengths and weaknesses in terms of accuracy and search efficiency.