## Composite Image: Python Factorial Calculation
### Overview
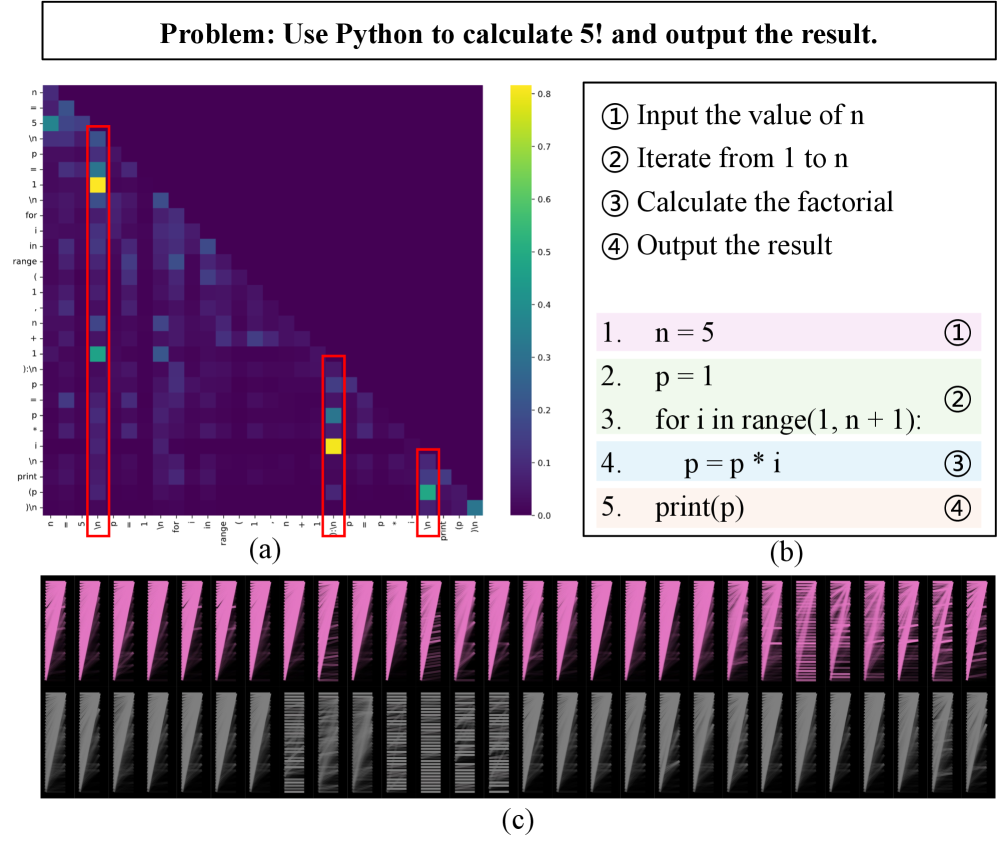
The image presents a multi-faceted view of a Python program designed to calculate the factorial of 5. It includes a heatmap-like visualization of code relationships, the Python code itself with annotations, and a series of visualizations that appear to represent program execution or state.
### Components/Axes
**Image (a): Heatmap-like Visualization**
* **Axes:** The x and y axes are labeled with Python code snippets. The labels are:
* `n = 5`
* `p = 1`
* `for`
* `in`
* `range`
* `(1`
* `n`
* `+`
* `1):`
* `p =`
* `p *`
* `i`
* `print`
* `(p)`
* `\n`
* **Color Scale:** A vertical color bar on the right ranges from approximately 0.0 (dark purple) to 0.8 (yellow). The scale is marked with values 0.0, 0.1, 0.2, 0.3, 0.4, 0.5, 0.6, 0.7, and 0.8.
* **Red Rectangles:** Three red rectangles highlight specific columns in the heatmap, corresponding to the code snippets `n = 5`, `p = p * i`, and `print(p)`.
**Image (b): Python Code with Annotations**
* **Code:** The Python code is presented as follows:
1. `n = 5`
2. `p = 1`
3. `for i in range(1, n + 1):`
4. `p = p * i`
5. `print(p)`
* **Annotations:** The code lines are annotated with circled numbers: ①, ②, ③, and ④. These correspond to the steps outlined above the code:
* ① Input the value of n
* ② Iterate from 1 to n
* ③ Calculate the factorial
* ④ Output the result
* **Background Colors:** Each line of code has a distinct background color:
* Line 1 (`n = 5`): Light pink
* Line 2 (`p = 1`): Light green
* Line 3 (`for i in range(1, n + 1):`): Light blue
* Line 4 (`p = p * i`): Light green
* Line 5 (`print(p)`): Light orange
**Image (c): Visualizations**
* **Arrangement:** Image (c) consists of two rows of visualizations. The top row appears to be pink and the bottom row appears to be gray. Each row contains a series of similar visualizations.
### Detailed Analysis or ### Content Details
**Image (a): Heatmap-like Visualization**
* The heatmap shows the relationships between different parts of the code. The intensity of the color at each intersection indicates the strength of the relationship.
* The highlighted columns show the relationships of `n = 5`, `p = p * i`, and `print(p)` with all other code snippets.
* The brightest (yellow) cells indicate the strongest relationships. For example, the intersection of `n = 5` with itself is bright, as is the intersection of `p = p * i` with itself.
**Image (b): Python Code with Annotations**
* The code calculates the factorial of 5.
* `n` is initialized to 5.
* `p` is initialized to 1.
* The `for` loop iterates from 1 to `n + 1` (i.e., 1 to 6).
* In each iteration, `p` is multiplied by `i`.
* Finally, `p` (the factorial of 5) is printed.
**Image (c): Visualizations**
* The visualizations in image (c) are difficult to interpret without additional context. They may represent the state of variables or the flow of execution during the program's execution.
* The top row (pink) and bottom row (gray) may represent different aspects of the program's state.
### Key Observations
* The heatmap highlights the relationships between different parts of the code.
* The annotations in image (b) clearly explain the steps involved in calculating the factorial.
* The visualizations in image (c) are abstract and require further context for interpretation.
### Interpretation
The image provides a comprehensive view of a simple Python program. The heatmap offers a visual representation of code relationships, while the annotated code clearly explains the algorithm. The visualizations in image (c) likely represent the program's execution, but their specific meaning is unclear without additional information. The combination of these elements provides a multi-faceted understanding of the program's functionality.