## Heatmap: Co-occurrence Analysis of Contextual Elements
### Overview
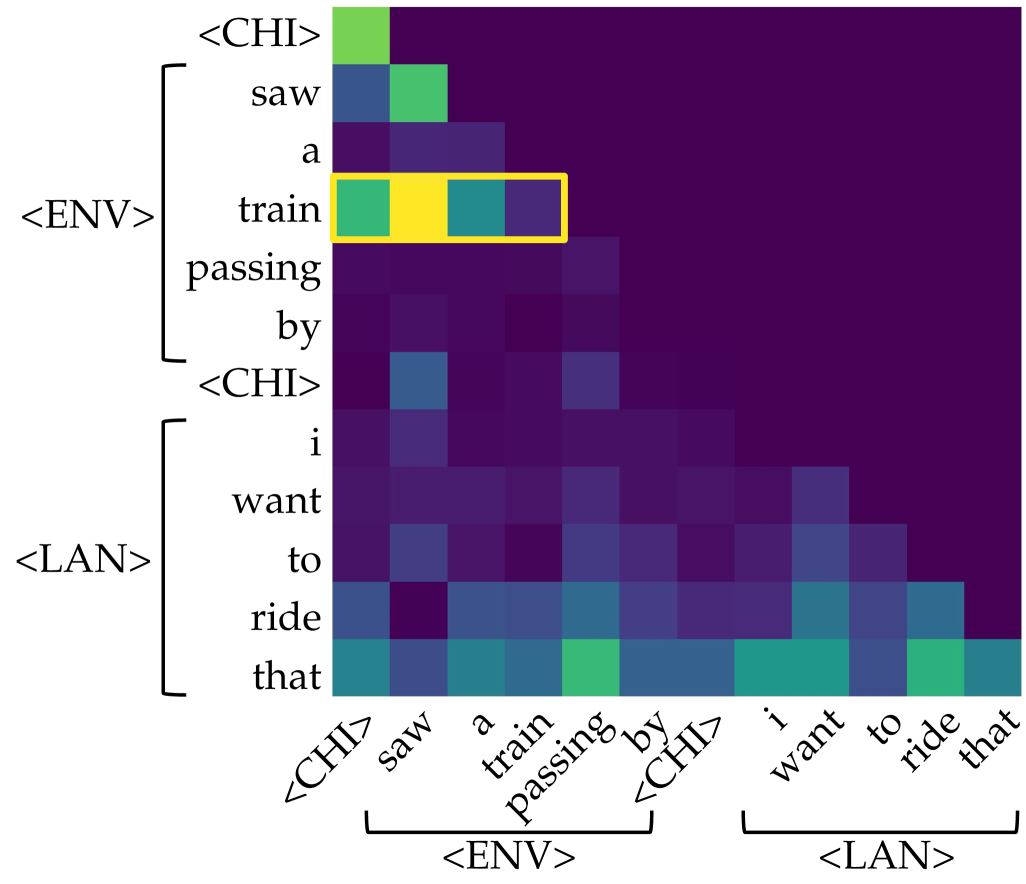
The image is a heatmap visualizing relationships between contextual elements across three domains: <CHI> (likely "Character"), <ENV> (Environment), and <LAN> (Language). The grid uses color intensity to represent associations between row and column labels, with a highlighted yellow rectangle emphasizing a specific interaction.
### Components/Axes
- **Rows (Y-axis)**:
- `<CHI>` (Character)
- `<ENV>` (Environment)
- `<LAN>` (Language)
- **Columns (X-axis)**:
- `<CHI>` (Character)
- `<ENV>` (Environment)
- `<LAN>` (Language)
- Words: "saw," "a," "train," "passing," "by," "i," "want," "to," "ride," "that"
- **Legend**:
- Green (light intensity)
- Blue (medium intensity)
- Purple (dark intensity)
- Yellow (highlighted anomaly)
- **Highlighted Area**: Yellow rectangle around "train" (row `<ENV>`) and "passing" (column `<CHI>`).
### Detailed Analysis
- **Color Distribution**:
- **<CHI> Row**: Predominantly purple (dark) with sparse green (light) in the `<CHI>` column.
- **<ENV> Row**: Mixed colors, with the highlighted yellow rectangle at the intersection of "train" (row) and "passing" (column).
- **<LAN> Row**: Gradual shift from purple (dark) to teal (medium) in the `<LAN>` column.
- **Key Values**:
- The yellow rectangle suggests an outlier or significant interaction between "train" (environment) and "passing" (character).
- No numerical values are provided; color intensity is qualitative.
### Key Observations
1. **Highlighted Interaction**: The yellow rectangle draws attention to the relationship between "train" (environment) and "passing" (character), implying a notable or unexpected association.
2. **Color Gradient**: Darker purple dominates the grid, suggesting stronger associations in most interactions, while lighter green appears sparsely.
3. **Domain-Specific Patterns**:
- `<LAN>` row shows a gradient from dark purple to teal, indicating diminishing intensity toward the `<LAN>` column.
- `<ENV>` row has the most variability, with the highlighted area breaking the pattern.
### Interpretation
The heatmap likely represents co-occurrence or contextual relationships between elements in a narrative or dataset. The highlighted yellow area suggests a critical interaction between environmental "train" and character "passing," possibly indicating a focal point in a story or dataset. The lack of numerical values limits quantitative analysis, but the color gradient implies a hierarchy of associations, with darker colors representing stronger links. The <LAN> row’s gradient may reflect diminishing relevance or frequency as the column shifts toward language-specific terms. The highlighted anomaly warrants further investigation to determine its significance in the broader context.