## Scatter Plot: Accuracy vs. Time-to-Answer
### Overview
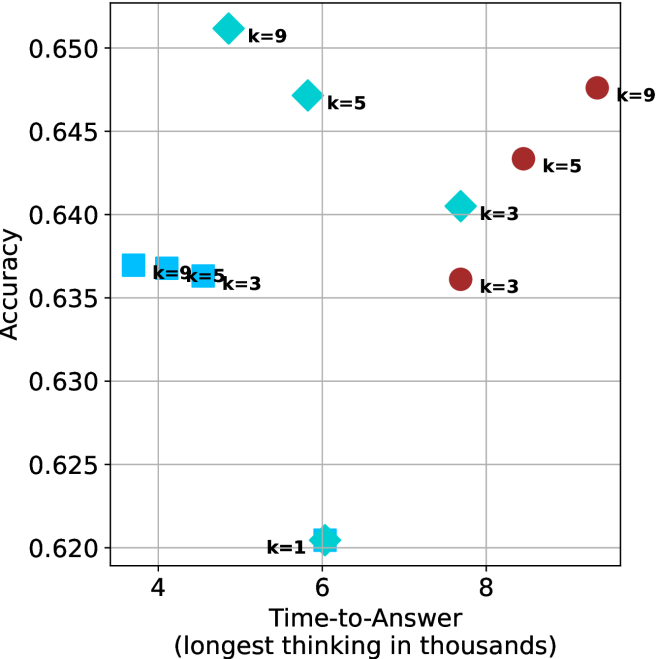
This image is a scatter plot visualizing the performance of different configurations (likely machine learning models or algorithms) based on two metrics: "Accuracy" (y-axis) and "Time-to-Answer" (x-axis). The data points are categorized by shape and color, with each point labeled with a "k" value (k=1, 3, 5, or 9), representing a specific parameter setting.
### Components/Axes
* **Y-Axis:** "Accuracy". The scale ranges from 0.620 to 0.650, with major grid lines at 0.005 intervals.
* **X-Axis:** "Time-to-Answer (longest thinking in thousands)". The scale ranges from 4 to 8+, with major grid lines at intervals of 2.
* **Data Series (Categorized by Shape/Color):**
* **Cyan Squares:** Located in the left-middle region.
* **Cyan Diamonds:** Located in the upper-middle region.
* **Cyan Star/Asterisk:** Located at the bottom-center.
* **Maroon Circles:** Located in the right region.
### Detailed Analysis
#### 1. Cyan Squares (Left Cluster)
* **Trend:** As the "k" value increases from 3 to 9, the Time-to-Answer decreases slightly, while Accuracy remains relatively stable.
* **Data Points:**
* **k=3:** x ≈ 4.6, y ≈ 0.636
* **k=5:** x ≈ 4.2, y ≈ 0.637
* **k=9:** x ≈ 3.8, y ≈ 0.637
#### 2. Cyan Diamonds (Upper-Middle Cluster)
* **Trend:** This group shows a strong inverse relationship between time and accuracy. As "k" increases, the Time-to-Answer decreases significantly, while Accuracy increases.
* **Data Points:**
* **k=3:** x ≈ 7.7, y ≈ 0.640
* **k=5:** x ≈ 5.6, y ≈ 0.647
* **k=9:** x ≈ 5.2, y ≈ 0.651
#### 3. Cyan Star (Bottom-Center)
* **Data Point:**
* **k=1:** x ≈ 6.0, y ≈ 0.620
* **Observation:** This represents the lowest accuracy and a moderate time-to-answer.
#### 4. Maroon Circles (Right Cluster)
* **Trend:** This group shows a positive correlation between time and accuracy. As "k" increases, both the Time-to-Answer and Accuracy increase.
* **Data Points:**
* **k=3:** x ≈ 7.7, y ≈ 0.636
* **k=5:** x ≈ 8.5, y ≈ 0.643
* **k=9:** x ≈ 9.3, y ≈ 0.647
### Key Observations
* **Efficiency Leader:** The **Cyan Diamonds** are the most efficient configuration. Specifically, the **k=9** diamond achieves the highest accuracy (≈0.651) while maintaining a relatively low time-to-answer (≈5.2).
* **Performance Trade-off:** The **Maroon Circles** demonstrate a traditional trade-off where higher accuracy requires more computational time.
* **Parameter Sensitivity:** The "k" parameter affects the four groups differently. In the Cyan Diamond group, increasing "k" is highly beneficial (faster and more accurate). In the Maroon Circle group, increasing "k" is costly (slower, though more accurate). In the Cyan Square group, "k" has minimal impact on accuracy but reduces time.
### Interpretation
This chart likely depicts the performance of an LLM (Large Language Model) or a similar reasoning system using different decoding strategies or search parameters (where "k" might represent beam width, top-k sampling, or a similar hyperparameter).
* **The "Cyan Diamond" strategy** appears to be the most optimized, suggesting that for this specific model/method, increasing the "k" parameter allows the model to find better answers faster, perhaps by pruning search paths more effectively.
* **The "Maroon Circle" strategy** represents a more standard computational behavior where more "thinking" (time) yields better results, but with diminishing returns on efficiency.
* **The "Cyan Square" strategy** suggests a configuration that is computationally cheap but hits a performance ceiling, where changing "k" does not yield significant accuracy gains.
* **The "Cyan Star" (k=1)** acts as a baseline or control, showing that a minimal "k" value results in the lowest performance, validating that increasing "k" is generally beneficial across the other groups.