## Grouped Bar Chart: Accuracy by SPARQL Path Length
### Overview
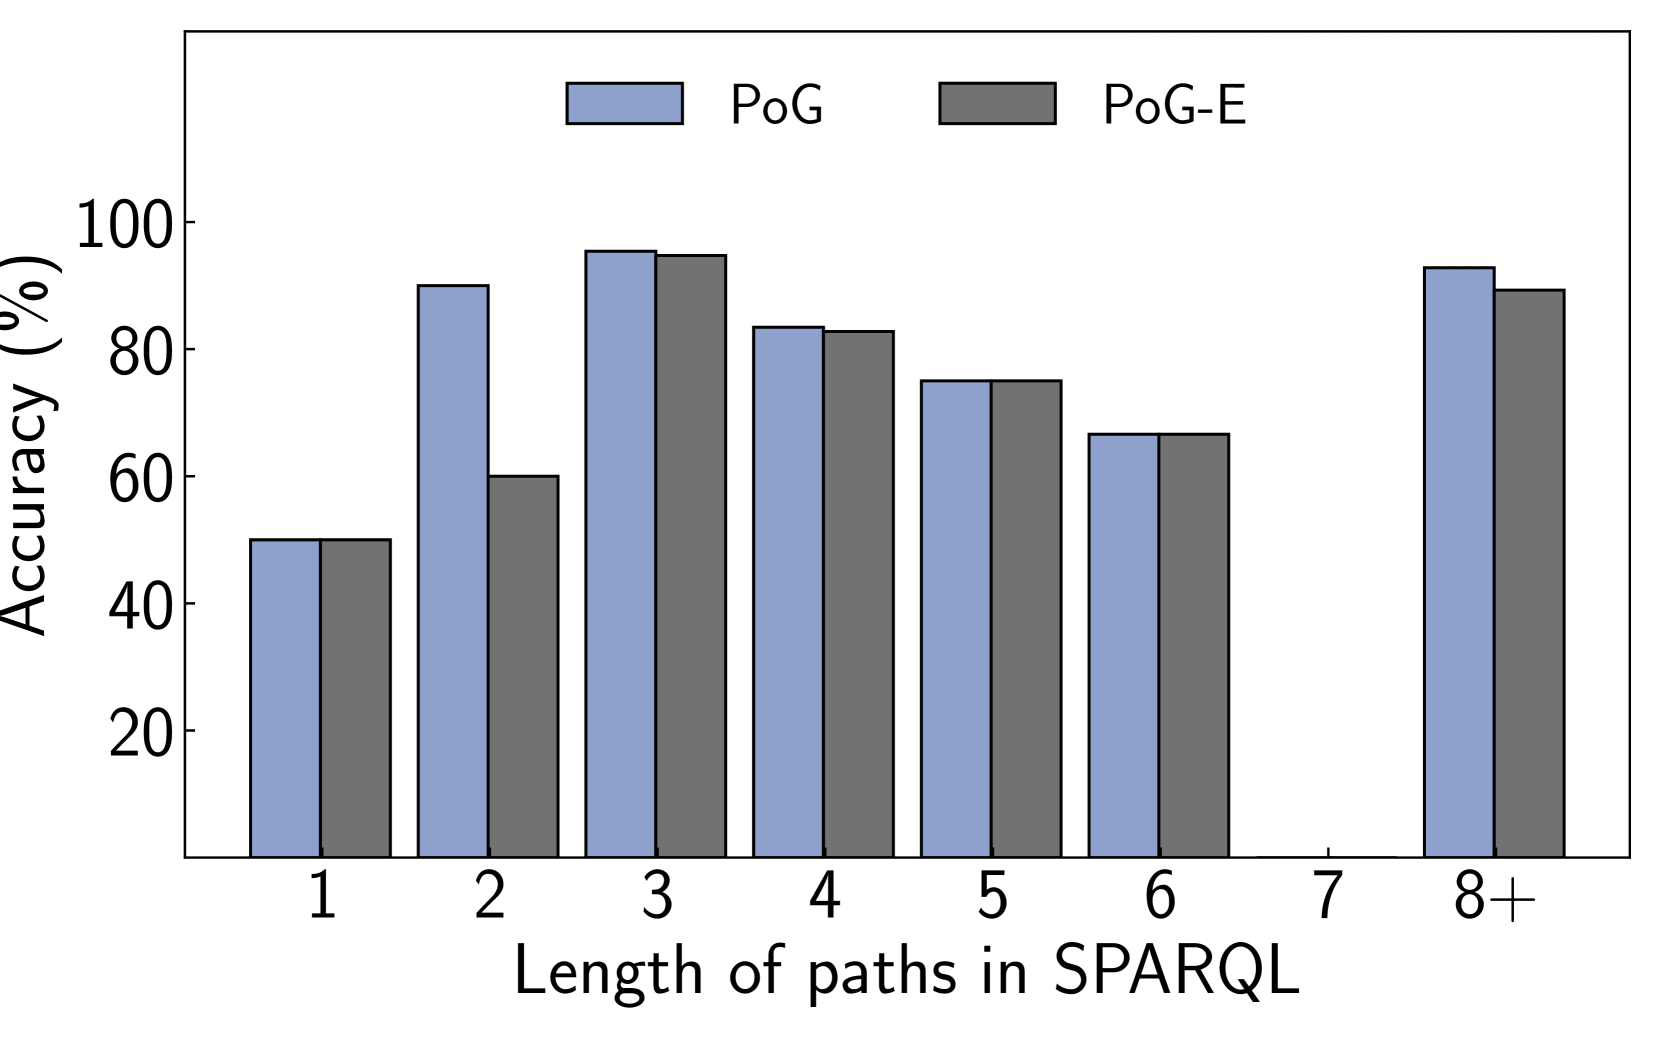
This is a grouped bar chart comparing the accuracy (in percentage) of two methods, labeled "PoG" and "PoG-E," across different path lengths in SPARQL queries. The chart visualizes how performance varies with increasing query complexity.
### Components/Axes
* **Chart Type:** Grouped vertical bar chart.
* **X-Axis (Horizontal):**
* **Label:** "Length of paths in SPARQL"
* **Categories (from left to right):** 1, 2, 3, 4, 5, 6, 7, 8+
* **Note:** There is no data plotted for category "7".
* **Y-Axis (Vertical):**
* **Label:** "Accuracy (%)"
* **Scale:** Linear, from 0 to 100.
* **Major Tick Marks:** 0, 20, 40, 60, 80, 100.
* **Legend:**
* **Position:** Top-center of the chart area.
* **Series 1:** "PoG" - Represented by light blue bars.
* **Series 2:** "PoG-E" - Represented by dark gray bars.
### Detailed Analysis
The following table reconstructs the approximate accuracy values for each method at each path length, derived from visual inspection of the bar heights against the y-axis scale.
| Path Length | PoG (Light Blue) Accuracy (%) | PoG-E (Dark Gray) Accuracy (%) |
| :--- | :--- | :--- |
| 1 | ~50 | ~50 |
| 2 | ~90 | ~60 |
| 3 | ~95 | ~94 |
| 4 | ~83 | ~82 |
| 5 | ~75 | ~75 |
| 6 | ~66 | ~66 |
| 7 | (No Data) | (No Data) |
| 8+ | ~92 | ~89 |
**Trend Verification:**
* **PoG (Blue):** The trend is non-monotonic. Accuracy starts at ~50% (length 1), jumps to a high of ~95% (length 3), then generally declines through lengths 4, 5, and 6 (to ~66%), before rebounding sharply to ~92% for the longest paths (8+).
* **PoG-E (Gray):** Follows a very similar pattern to PoG. It starts at ~50% (length 1), rises to ~94% (length 3), declines to ~66% (length 6), and rebounds to ~89% (length 8+). Its most significant deviation from PoG is at path length 2, where it is substantially lower (~60% vs. PoG's ~90%).
### Key Observations
1. **Peak Performance:** Both methods achieve their highest accuracy at a path length of 3.
2. **Performance Dip:** Both methods show a clear decline in accuracy for intermediate path lengths (4, 5, 6), reaching a local minimum at length 6.
3. **Strong Recovery:** Both methods demonstrate a significant recovery in accuracy for the longest path category (8+), nearly matching their peak performance.
4. **Convergence at Certain Lengths:** The accuracy of PoG and PoG-E is nearly identical at path lengths 1, 3, 4, 5, and 6.
5. **Major Divergence:** The most notable difference occurs at path length 2, where PoG (~90%) significantly outperforms PoG-E (~60%).
6. **Missing Data:** There is a complete absence of data for path length 7, creating a gap in the trend analysis.
### Interpretation
The data suggests that the complexity of a SPARQL query, as measured by path length, has a non-linear impact on the accuracy of both the PoG and PoG-E methods. The relationship is not a simple case of "longer paths are harder."
* **The "Sweet Spot":** Queries with a path length of 3 appear to be the most reliably handled by both systems, possibly representing an optimal balance between query complexity and the methods' reasoning capabilities.
* **The "Intermediate Challenge":** The decline in accuracy for lengths 4-6 indicates a zone of increased difficulty. This could be due to a combinatorial explosion in possible reasoning paths or increased ambiguity in longer, but not longest, queries.
* **The "Long-Path Resilience":** The strong performance on the "8+" category is intriguing. It may suggest that very long paths are often more structured or follow more predictable patterns, or that the methods employ different strategies for handling extreme complexity that are effective. Alternatively, the "8+" category might be dominated by a specific, easier subclass of long queries.
* **Method Comparison:** PoG and PoG-E are largely comparable, with the critical exception of path length 2. This specific divergence warrants investigation—it may reveal a flaw in PoG-E's handling of a particular query pattern common at that length, or a specific strength of PoG. The fact that they converge at other lengths suggests their core mechanisms are similar, but differ in this one edge case.
**In summary,** the chart reveals that query accuracy is highly dependent on path length in a specific, non-linear pattern. The most significant finding is the dramatic performance gap at length 2, which is the primary differentiator between the two otherwise closely matched methods. The missing data for length 7 is a notable limitation in the presented results.