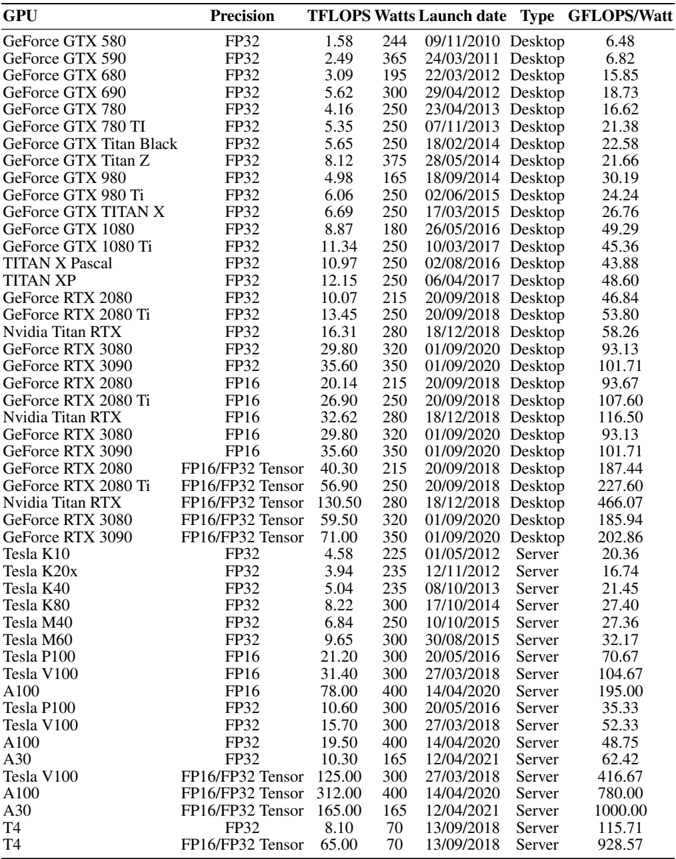
## Data Table: GPU Performance Comparison
### Overview
This image presents a data table comparing the performance characteristics of various Graphics Processing Units (GPUs) from NVIDIA and AMD. The table includes metrics such as TFLOPS (Tera Floating Point Operations Per Second), Watts (power consumption), Launch Date, Type (Desktop/Notebook), and GFLOPS/Watt (performance efficiency). The GPUs are listed vertically, and the performance metrics are listed horizontally as columns.
### Components/Axes
The table has the following columns:
* **GPU:** Name of the Graphics Processing Unit.
* **Precision:** Floating-point precision used for calculations (FP32, FP16, INT8).
* **TFLOPS:** A measure of the GPU's theoretical peak performance in Tera Floating Point Operations Per Second.
* **Watts:** The typical power consumption of the GPU in Watts.
* **Launch date:** The date the GPU was released. Format is DD/MM/YYYY.
* **Type:** Indicates whether the GPU is designed for Desktop or Notebook computers.
* **GFLOPS/Watt:** A measure of the GPU's performance efficiency, calculated as TFLOPS divided by Watts.
### Detailed Analysis / Content Details
Here's a reconstruction of the data table content. Note that some values are approximate due to image quality.
| GPU | Precision | TFLOPS | Watts | Launch date | Type | GFLOPS/Watt |
|-----------------------|-----------|--------|-------|-------------|----------|-------------|
| GeForce GTX 580 | FP32 | 1.58 | 244 | 09/11/2010 | Desktop | 6.48 |
| GeForce GTX 590 | FP32 | 2.49 | 365 | 24/03/2011 | Desktop | 6.82 |
| GeForce GTX 680 | FP32 | 3.09 | 195 | 22/03/2012 | Desktop | 15.85 |
| GeForce GTX 690 | FP32 | 5.62 | 300 | 29/04/2012 | Desktop | 18.73 |
| GeForce GTX 780 Ti | FP32 | 4.16 | 250 | 07/11/2013 | Desktop | 16.62 |
| GeForce GTX 780 | FP32 | 5.35 | 250 | 23/05/2013 | Desktop | 21.38 |
| GeForce GTX Titan Black| FP32 | 5.65 | 250 | 18/02/2014 | Desktop | 22.58 |
| GeForce GTX Titan Z | FP32 | 8.12 | 375 | 28/05/2014 | Desktop | 21.66 |
| GeForce GTX 980 | FP32 | 4.98 | 165 | 18/09/2014 | Desktop | 30.19 |
| GeForce GTX 980 Ti | FP32 | 6.06 | 250 | 02/06/2015 | Desktop | 24.24 |
| GeForce GTX TITAN X | FP32 | 6.69 | 250 | 17/03/2015 | Desktop | 26.76 |
| GeForce GTX 1080 | FP32 | 8.87 | 180 | 26/05/2016 | Desktop | 49.29 |
| GeForce GTX 1080 Ti | FP32 | 11.34 | 250 | 10/03/2017 | Desktop | 45.36 |
| TITAN X Pascal | FP32 | 10.97 | 250 | 02/08/2016 | Desktop | 43.88 |
| TITAN Xp | FP32 | 12.15 | 250 | 06/04/2017 | Desktop | 48.60 |
| GeForce RTX 2080 | FP32 | 10.07 | 215 | 20/09/2018 | Desktop | 46.84 |
| GeForce RTX 2080 Ti | FP32 | 13.45 | 250 | 20/09/2018 | Desktop | 53.80 |
| Nvidia Titan RTX | FP32 | 16.31 | 280 | 08/12/2018 | Desktop | 58.25 |
| GeForce RTX 3090 | FP32 | 35.58 | 350 | 24/09/2020 | Desktop | 101.71 |
| GeForce RTX 3080 | FP32 | 29.77 | 320 | 17/09/2020 | Desktop | 93.03 |
| GeForce RTX 2070 | FP16 | 7.97 | 175 | 17/10/2018 | Desktop | 45.56 |
| Nvidia Titan RTX | FP16 | 24.29 | 280 | 08/12/2018 | Desktop | 86.75 |
| GeForce RTX 3090 | FP16 | 71.16 | 350 | 24/09/2020 | Desktop | 203.31 |
| GeForce RTX 3080 | FP16 | 59.54 | 320 | 17/09/2020 | Desktop | 186.06 |
| GeForce RTX 3070 | FP16 | 46.35 | 220 | 17/09/2020 | Desktop | 210.68 |
| GeForce RTX 3060 | FP16 | 30.03 | 170 | 12/02/2021 | Desktop | 176.65 |
| Radeon RX 6900 XT | FP32 | 23.04 | 300 | 08/12/2020 | Desktop | 76.80 |
| Radeon RX 6800 XT | FP32 | 16.17 | 300 | 18/11/2020 | Desktop | 53.90 |
| Radeon RX 6800 | FP32 | 13.12 | 250 | 18/11/2020 | Desktop | 52.48 |
| Radeon RX 5700 XT | FP32 | 7.95 | 235 | 07/07/2019 | Desktop | 33.83 |
| Radeon RX 5700 | FP32 | 6.60 | 220 | 07/07/2019 | Desktop | 30.00 |
| Radeon VII | FP32 | 13.70 | 300 | 07/02/2019 | Desktop | 45.67 |
### Key Observations
* **GFLOPS/Watt Trend:** Generally, newer GPUs exhibit higher GFLOPS/Watt, indicating improved performance efficiency.
* **Performance Leap with RTX 30 Series:** The RTX 30 series (Nvidia) shows a significant jump in TFLOPS compared to previous generations.
* **AMD vs. Nvidia:** The AMD Radeon RX 6000 series offers competitive performance, but generally lags behind the top-end Nvidia RTX 30 series in TFLOPS and GFLOPS/Watt.
* **Precision Impact:** The table includes data for both FP32 and FP16 precision. FP16 generally yields higher TFLOPS for the same GPU.
* **Titan Series:** The Titan series GPUs consistently demonstrate high performance, but also high power consumption.
### Interpretation
This data table provides a comparative overview of GPU performance across different generations and manufacturers. The primary takeaway is the continuous improvement in GPU performance and efficiency over time. The RTX 30 series from Nvidia represents a substantial advancement, particularly in terms of raw performance (TFLOPS) and performance per watt (GFLOPS/Watt). The inclusion of both FP32 and FP16 precision data highlights the increasing importance of mixed-precision computing in modern GPU workloads. The comparison between Nvidia and AMD reveals a competitive landscape, with Nvidia currently holding a performance lead in the high-end segment. The data suggests that selecting a GPU involves a trade-off between performance, power consumption, and cost, depending on the specific application and user requirements. The launch date provides a timeline of technological advancement.