TECHNICAL ASSET FINGERPRINT
415ee1ac59c9976aadfe6487
Click to view fullscreen
Press ESC or click to close
FOUND IN PAPERS
EXPERT: healer-alpha-free VERSION 1
RUNTIME: free/openrouter/healer-alpha
INTEL_VERIFIED
## Bar Chart: Accuracy by Condition
### Overview
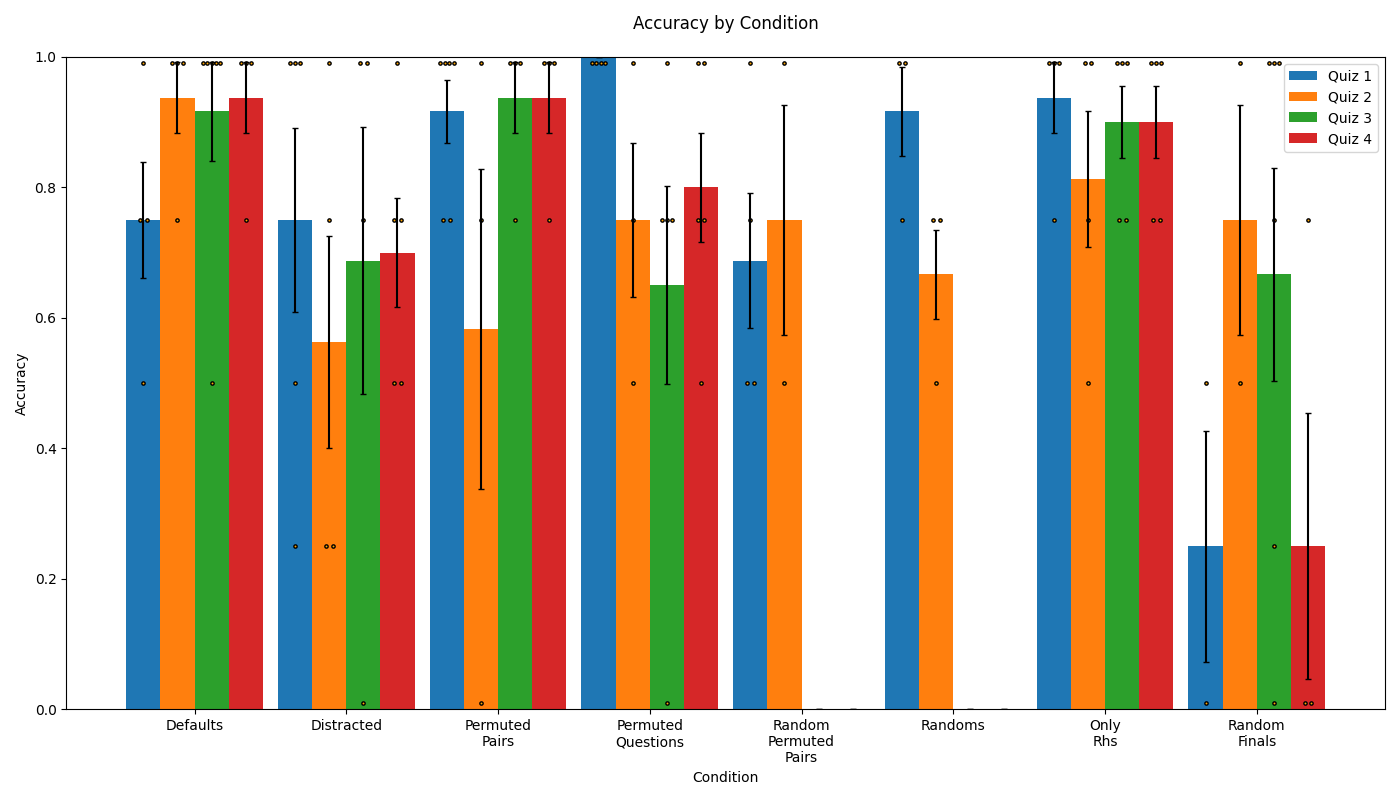
This is a grouped bar chart titled "Accuracy by Condition." It displays the accuracy scores (ranging from 0.0 to 1.0) for four different quizzes (Quiz 1, Quiz 2, Quiz 3, Quiz 4) across eight distinct experimental conditions. Each bar includes an error bar (likely representing standard deviation or standard error) and is overlaid with small circles representing individual data points.
### Components/Axes
* **Chart Title:** "Accuracy by Condition" (top center).
* **Y-Axis:** Labeled "Accuracy." Scale runs from 0.0 to 1.0 in increments of 0.2.
* **X-Axis:** Labeled "Condition." Contains eight categorical groups:
1. Defaults
2. Distracted
3. Permuted Pairs
4. Permuted Questions
5. Random Permuted Pairs
6. Randoms
7. Only Rhs
8. Random Finals
* **Legend:** Located in the top-right corner. Maps colors to quiz identifiers:
* Blue: Quiz 1
* Orange: Quiz 2
* Green: Quiz 3
* Red: Quiz 4
* **Data Representation:** For each condition, up to four colored bars are plotted side-by-side. Each bar's height represents the mean accuracy for that quiz under that condition. Black vertical lines (error bars) extend from the top of each bar. Small, hollow circles are scattered vertically above/below each bar, indicating individual participant or trial scores.
### Detailed Analysis
**Accuracy Values by Condition (Approximate Mean ± Error Bar Range):**
1. **Defaults:**
* Quiz 1 (Blue): ~0.75 (Error bar: ~0.66 to ~0.84)
* Quiz 2 (Orange): ~0.94 (Error bar: ~0.88 to ~1.0)
* Quiz 3 (Green): ~0.92 (Error bar: ~0.84 to ~1.0)
* Quiz 4 (Red): ~0.94 (Error bar: ~0.88 to ~1.0)
2. **Distracted:**
* Quiz 1 (Blue): ~0.75 (Error bar: ~0.61 to ~0.89)
* Quiz 2 (Orange): ~0.56 (Error bar: ~0.40 to ~0.72)
* Quiz 3 (Green): ~0.69 (Error bar: ~0.49 to ~0.89)
* Quiz 4 (Red): ~0.70 (Error bar: ~0.62 to ~0.78)
3. **Permuted Pairs:**
* Quiz 1 (Blue): ~0.92 (Error bar: ~0.87 to ~0.97)
* Quiz 2 (Orange): ~0.58 (Error bar: ~0.34 to ~0.82)
* Quiz 3 (Green): ~0.94 (Error bar: ~0.88 to ~1.0)
* Quiz 4 (Red): ~0.94 (Error bar: ~0.88 to ~1.0)
4. **Permuted Questions:**
* Quiz 1 (Blue): 1.0 (Error bar: ~0.93 to ~1.0)
* Quiz 2 (Orange): ~0.75 (Error bar: ~0.63 to ~0.87)
* Quiz 3 (Green): ~0.65 (Error bar: ~0.50 to ~0.80)
* Quiz 4 (Red): ~0.80 (Error bar: ~0.72 to ~0.88)
5. **Random Permuted Pairs:**
* Quiz 1 (Blue): ~0.69 (Error bar: ~0.59 to ~0.79)
* Quiz 2 (Orange): ~0.75 (Error bar: ~0.57 to ~0.93)
* *Quiz 3 and Quiz 4 are not present for this condition.*
6. **Randoms:**
* Quiz 1 (Blue): ~0.92 (Error bar: ~0.84 to ~1.0)
* Quiz 2 (Orange): ~0.67 (Error bar: ~0.60 to ~0.74)
* *Quiz 3 and Quiz 4 are not present for this condition.*
7. **Only Rhs:**
* Quiz 1 (Blue): ~0.94 (Error bar: ~0.88 to ~1.0)
* Quiz 2 (Orange): ~0.81 (Error bar: ~0.71 to ~0.91)
* Quiz 3 (Green): ~0.90 (Error bar: ~0.84 to ~0.96)
* Quiz 4 (Red): ~0.90 (Error bar: ~0.84 to ~0.96)
8. **Random Finals:**
* Quiz 1 (Blue): ~0.25 (Error bar: ~0.07 to ~0.43)
* Quiz 2 (Orange): ~0.75 (Error bar: ~0.57 to ~0.93)
* Quiz 3 (Green): ~0.67 (Error bar: ~0.50 to ~0.84)
* Quiz 4 (Red): ~0.25 (Error bar: ~0.05 to ~0.45)
### Key Observations
1. **Condition-Specific Performance:** Accuracy varies dramatically by condition. "Only Rhs" and "Defaults" yield high, consistent performance across all quizzes. "Random Finals" causes a severe performance drop for Quiz 1 and Quiz 4.
2. **Quiz Vulnerability:** Quiz 1 (Blue) and Quiz 4 (Red) are highly sensitive to the "Random Finals" condition, with accuracies plummeting to ~0.25. They are otherwise relatively robust.
3. **Quiz 2 (Orange) Volatility:** Quiz 2 shows the widest performance swing. It is top-performing in "Defaults" (~0.94) but drops significantly in "Distracted" (~0.56) and "Permuted Pairs" (~0.58).
4. **Missing Data:** The "Random Permuted Pairs" and "Randoms" conditions only include data for Quiz 1 and Quiz 2, suggesting the experimental design did not apply these conditions to Quizzes 3 and 4.
5. **High Variability:** Several conditions, particularly "Distracted" and "Permuted Pairs" for Quiz 2, show very large error bars, indicating inconsistent performance among participants/trials.
6. **Individual Data Points:** The scattered circles show that even in high-average conditions (e.g., Quiz 1 in "Permuted Questions"), there is a spread of individual scores, though they cluster near the top. In low-average conditions (e.g., Quiz 1 in "Random Finals"), the points are spread across a lower range.
### Interpretation
The chart demonstrates how different types of structural manipulations (distractions, permutations, randomization) to quiz content affect performance in a quiz-dependent manner.
* **Robustness vs. Fragility:** Quizzes 3 and 4 appear generally robust, maintaining high accuracy except under the specific "Random Finals" disruption for Quiz 4. Quiz 1 is also robust except for that same "Random Finals" condition. This suggests the knowledge or skills tested in Quizzes 1, 3, and 4 are less dependent on the specific ordering or presentation of final questions.
* **The "Random Finals" Anomaly:** The catastrophic drop for Quiz 1 and Quiz 4 in "Random Finals" is the most striking finding. This implies these quizzes may have a strong sequential or cumulative structure where the final questions are critically dependent on the context established by earlier questions. Randomizing the finals destroys this structure. Quiz 2 and 3, which are less affected, may have more independent questions.
* **The Cost of Distraction:** The "Distracted" condition uniformly lowers accuracy compared to "Defaults," but the effect is most pronounced for Quiz 2. This could indicate that Quiz 2 requires more focused attention or working memory.
* **Permutation Effects:** "Permuted Pairs" severely harms Quiz 2 but not others, suggesting Quiz 2's content relies on specific pair relationships. "Permuted Questions" uniquely benefits Quiz 1 (to perfect accuracy) while harming Quiz 3, indicating opposite dependencies on question order.
In summary, the data suggests that the underlying structure of the quiz material interacts powerfully with the type of disruption applied. The "Random Finals" condition acts as a diagnostic tool, revealing a critical structural dependency in Quizzes 1 and 4 that is absent in Quizzes 2 and 3.
DECODING INTELLIGENCE...