## Diagram: State Transition and Interaction Models
### Overview
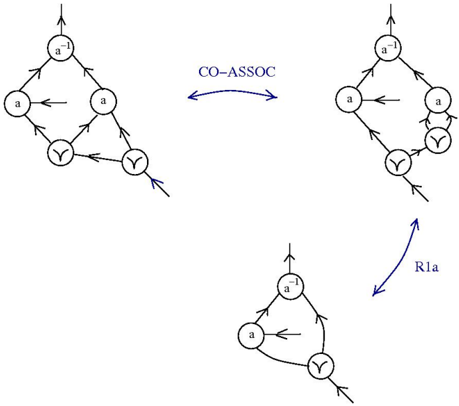
The image depicts three interconnected diagrams labeled **CO-ASSOC**, **R1a**, and a simplified third diagram. Each diagram consists of nodes labeled **a**, **a⁻¹**, and **Y**, connected by directional arrows. The diagrams illustrate relationships or transitions between these nodes, with varying arrow configurations.
### Components/Axes
- **Nodes**:
- **a**: Represented as a circle with a label "a".
- **a⁻¹**: Represented as a circle with a label "a⁻¹" (inverse of "a").
- **Y**: Represented as a circle with a label "Y".
- **Arrows**:
- **Bidirectional arrows** (e.g., between **a** and **a⁻¹** in CO-ASSOC).
- **Unidirectional arrows** (e.g., from **a** to **Y** in CO-ASSOC and R1a).
- **Labels**:
- **CO-ASSOC**: Indicates a co-association or mutual relationship.
- **R1a**: Likely a specific interaction or rule (e.g., "Rule 1a").
### Detailed Analysis
1. **CO-ASSOC Diagram**:
- **Nodes**: **a**, **a⁻¹**, and **Y**.
- **Arrows**:
- **a ↔ a⁻¹**: Bidirectional arrows suggest a mutual or reciprocal relationship.
- **a → Y**: Unidirectional arrow from **a** to **Y**, indicating a one-way influence or transition.
- **Structure**: Forms a triangular configuration with **Y** connected to **a**.
2. **R1a Diagram**:
- **Nodes**: **a**, **a⁻¹**, and **Y**.
- **Arrows**:
- **a → a⁻¹**: Unidirectional arrow from **a** to **a⁻¹**.
- **a⁻¹ → Y**: Unidirectional arrow from **a⁻¹** to **Y**.
- **Y → a**: Unidirectional arrow from **Y** back to **a**, forming a cycle.
- **Structure**: A linear chain with a feedback loop from **Y** to **a**.
3. **Simplified Diagram**:
- **Nodes**: **a**, **a⁻¹**, and **Y**.
- **Arrows**:
- **a → a⁻¹**: Unidirectional arrow from **a** to **a⁻¹**.
- **a⁻¹ → Y**: Unidirectional arrow from **a⁻¹** to **Y**.
- **Structure**: A linear flow without feedback.
### Key Observations
- **CO-ASSOC** emphasizes mutual relationships (bidirectional arrows) and a direct influence of **a** on **Y**.
- **R1a** introduces a cyclic dependency, where **Y** feeds back into **a**, creating a closed loop.
- The simplified diagram removes the feedback loop, suggesting a linear or sequential process.
### Interpretation
The diagrams likely represent different states or interaction models in a system:
- **CO-ASSOC** could model a co-association where **a** and **a⁻¹** are interdependent, with **Y** being influenced by **a**.
- **R1a** might represent a rule or process where **a** transitions to **a⁻¹**, which then affects **Y**, which in turn influences **a** again, creating a self-reinforcing cycle.
- The simplified diagram may illustrate a baseline or initial state without feedback mechanisms.
The presence of **a⁻¹** (inverse of **a**) suggests a focus on reciprocal or inverse relationships, possibly in mathematical, logical, or computational contexts. The directional arrows highlight causality or influence, while the labels **CO-ASSOC** and **R1a** imply specific rules or associations governing these interactions.