## Line Charts: Average Attention Weight vs. Token Index
### Overview
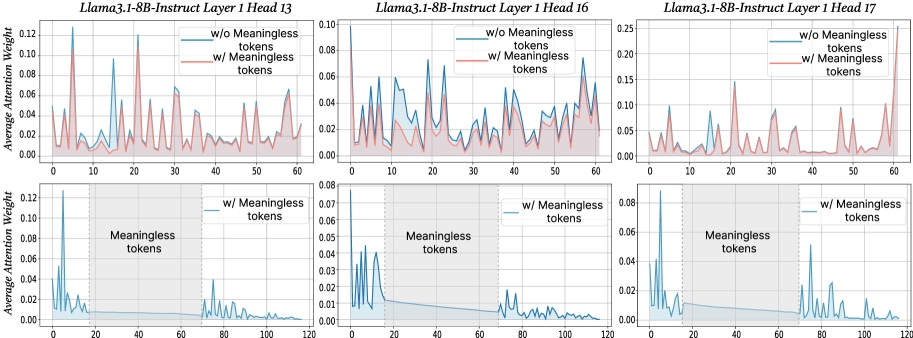
The image presents six line charts arranged in a 2x3 grid. Each chart displays the average attention weight of tokens in the Llama3.1-8B-Instruct model, specifically for Layer 1 and different heads (13, 16, and 17). The top row of charts compares attention weights with and without "meaningless" tokens, while the bottom row focuses solely on attention weights with "meaningless" tokens, highlighting a specific region where these tokens are present.
### Components/Axes
**General Chart Elements:**
* **Titles:** Each chart has a title indicating the model, layer, and head number (e.g., "Llama3.1-8B-Instruct Layer 1 Head 13").
* **X-axis:** Represents the token index. The top row charts range from 0 to 60, while the bottom row charts range from 0 to 120.
* **Y-axis:** Represents the average attention weight, ranging from 0.00 to approximately 0.12 in the left and middle columns, and 0.00 to 0.25 in the right column for the top row. The bottom row y-axis ranges from 0.00 to 0.08.
* **Grid:** All charts have a light gray grid.
* **Legend:** Each chart in the top row has a legend in the top-right corner:
* Blue line: "w/o Meaningless tokens"
* Red line: "w/ Meaningless tokens"
* **Shaded Region:** The bottom row charts have a shaded gray region labeled "Meaningless tokens" spanning approximately from token index 20 to 70.
**Specific Chart Details:**
* **Top Row:** Compares attention weights with and without meaningless tokens.
* **Bottom Row:** Shows attention weights with meaningless tokens, highlighting the region where these tokens are present.
### Detailed Analysis
**Chart 1: Llama3.1-8B-Instruct Layer 1 Head 13 (Top-Left)**
* **X-axis:** 0 to 60
* **Y-axis:** 0.00 to 0.12
* **"w/o Meaningless tokens" (Blue):** The line fluctuates, with peaks around token indices 5, 20, 30, and 50.
* Approximate values: 5 (0.05), 20 (0.06), 30 (0.07), 50 (0.04)
* **"w/ Meaningless tokens" (Red):** The line also fluctuates, generally following the blue line but with slightly lower values.
* Approximate values: 5 (0.04), 20 (0.08), 30 (0.06), 50 (0.03)
**Chart 2: Llama3.1-8B-Instruct Layer 1 Head 16 (Top-Middle)**
* **X-axis:** 0 to 60
* **Y-axis:** 0.00 to 0.10
* **"w/o Meaningless tokens" (Blue):** The line fluctuates significantly, with peaks around token indices 5, 15, 30, 40, and 55.
* Approximate values: 5 (0.06), 15 (0.05), 30 (0.06), 40 (0.05), 55 (0.04)
* **"w/ Meaningless tokens" (Red):** The line generally follows the blue line, but with lower peaks.
* Approximate values: 5 (0.04), 15 (0.04), 30 (0.05), 40 (0.04), 55 (0.03)
**Chart 3: Llama3.1-8B-Instruct Layer 1 Head 17 (Top-Right)**
* **X-axis:** 0 to 60
* **Y-axis:** 0.00 to 0.25
* **"w/o Meaningless tokens" (Blue):** The line fluctuates, with peaks around token indices 5, 20, 30, 40, 50, and 60.
* Approximate values: 5 (0.08), 20 (0.12), 30 (0.10), 40 (0.11), 50 (0.13), 60 (0.15)
* **"w/ Meaningless tokens" (Red):** The line generally follows the blue line, but with lower peaks.
* Approximate values: 5 (0.06), 20 (0.10), 30 (0.08), 40 (0.09), 50 (0.11), 60 (0.13)
**Chart 4: Llama3.1-8B-Instruct Layer 1 Head 13 (Bottom-Left)**
* **X-axis:** 0 to 120
* **Y-axis:** 0.00 to 0.12
* **"w/ Meaningless tokens" (Blue):** The line shows high peaks at the beginning (around token index 5), then decreases and remains low within the "Meaningless tokens" region (20-70), and then fluctuates again after token index 70.
* Approximate values: 5 (0.12), 30-60 (0.01), 80 (0.02), 100 (0.01)
* **Shaded Region:** "Meaningless tokens" region spans from approximately token index 20 to 70.
**Chart 5: Llama3.1-8B-Instruct Layer 1 Head 16 (Bottom-Middle)**
* **X-axis:** 0 to 120
* **Y-axis:** 0.00 to 0.08
* **"w/ Meaningless tokens" (Blue):** The line shows high peaks at the beginning (around token index 5), then decreases and remains low within the "Meaningless tokens" region (20-70), and then fluctuates again after token index 70.
* Approximate values: 5 (0.07), 30-60 (0.01), 80 (0.02), 100 (0.01)
* **Shaded Region:** "Meaningless tokens" region spans from approximately token index 20 to 70.
**Chart 6: Llama3.1-8B-Instruct Layer 1 Head 17 (Bottom-Right)**
* **X-axis:** 0 to 120
* **Y-axis:** 0.00 to 0.08
* **"w/ Meaningless tokens" (Blue):** The line shows high peaks at the beginning (around token index 5), then decreases and remains low within the "Meaningless tokens" region (20-70), and then fluctuates again after token index 70.
* Approximate values: 5 (0.08), 30-60 (0.01), 80 (0.02), 100 (0.01)
* **Shaded Region:** "Meaningless tokens" region spans from approximately token index 20 to 70.
### Key Observations
* The presence of "meaningless" tokens generally reduces the average attention weight compared to when they are absent (top row charts).
* The bottom row charts show that the attention weight is significantly lower within the "Meaningless tokens" region (token indices 20-70) compared to the regions outside this range.
* The attention weights fluctuate more in the top row charts (0-60 token index range) compared to the bottom row charts, especially within the "Meaningless tokens" region.
* Heads 13, 16, and 17 show similar patterns in attention weight distribution.
### Interpretation
The charts suggest that the Llama3.1-8B-Instruct model assigns lower attention weights to "meaningless" tokens in Layer 1. This is evident from the reduced attention weights when "meaningless" tokens are included (top row) and the low attention weights within the "Meaningless tokens" region (bottom row). This indicates that the model is likely designed to de-emphasize or ignore these tokens during processing, potentially to focus on more relevant information. The similar patterns across different heads (13, 16, and 17) suggest a consistent behavior in how the model handles these tokens within Layer 1. The initial peaks in attention weight before the "meaningless tokens" region in the bottom row charts could indicate the model is focusing on context before the meaningless tokens appear.