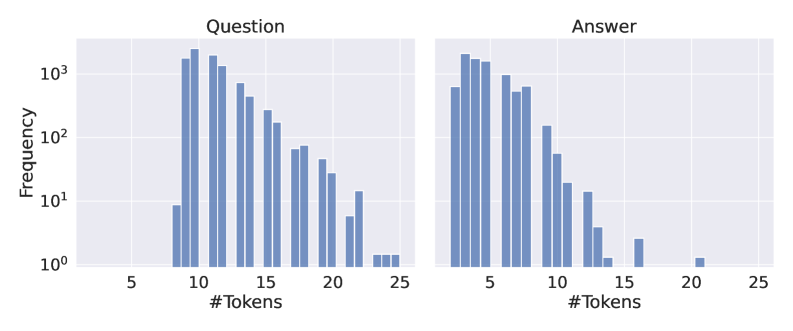
## Bar Chart: Token Frequency in Questions and Answers
### Overview
The image presents two bar charts side-by-side, comparing the frequency of different token lengths in "Question" and "Answer" texts. The y-axis (Frequency) is on a logarithmic scale, and the x-axis represents the number of tokens. Both charts show a similar trend: a high frequency of shorter token lengths, decreasing as the number of tokens increases.
### Components/Axes
* **Titles:** "Question" (left chart), "Answer" (right chart)
* **X-axis:** "#Tokens" (shared by both charts), with tick marks at 5, 10, 15, 20, and 25.
* **Y-axis:** "Frequency" (shared by both charts), with a logarithmic scale. Tick marks are at 10<sup>0</sup> (1), 10<sup>1</sup> (10), 10<sup>2</sup> (100), and 10<sup>3</sup> (1000).
* **Bars:** The bars in both charts are a uniform light blue color.
### Detailed Analysis
**Question Chart:**
* **Trend:** The frequency of questions decreases as the number of tokens increases.
* **Data Points:**
* 5 tokens: Frequency is approximately 10.
* 8 tokens: Frequency is approximately 1000.
* 10 tokens: Frequency is approximately 1500.
* 12 tokens: Frequency is approximately 1000.
* 15 tokens: Frequency is approximately 500.
* 18 tokens: Frequency is approximately 200.
* 20 tokens: Frequency is approximately 50.
* 23 tokens: Frequency is approximately 2.
* 25 tokens: Frequency is approximately 1.
**Answer Chart:**
* **Trend:** The frequency of answers decreases as the number of tokens increases.
* **Data Points:**
* 3 tokens: Frequency is approximately 1000.
* 5 tokens: Frequency is approximately 1500.
* 7 tokens: Frequency is approximately 800.
* 9 tokens: Frequency is approximately 600.
* 11 tokens: Frequency is approximately 300.
* 13 tokens: Frequency is approximately 100.
* 15 tokens: Frequency is approximately 20.
* 18 tokens: Frequency is approximately 2.
* 21 tokens: Frequency is approximately 1.
### Key Observations
* Both questions and answers exhibit a similar distribution of token lengths, with shorter lengths being much more frequent.
* The peak frequency for questions appears to be around 10 tokens, while for answers, it's around 5 tokens.
* The frequency drops off more rapidly for answers than for questions as the number of tokens increases.
### Interpretation
The data suggests that both questions and answers tend to be relatively short in terms of token count. The higher frequency of shorter answers compared to questions may indicate that answers are often concise and direct. The logarithmic scale emphasizes the significant difference in frequency between short and long texts. The charts provide a visual representation of the distribution of token lengths, which can be useful for understanding the characteristics of the question-answer dataset. The data could be used to inform decisions about text processing, model training, or data filtering.