\n
## Histograms: Token Frequency in Questions and Answers
### Overview
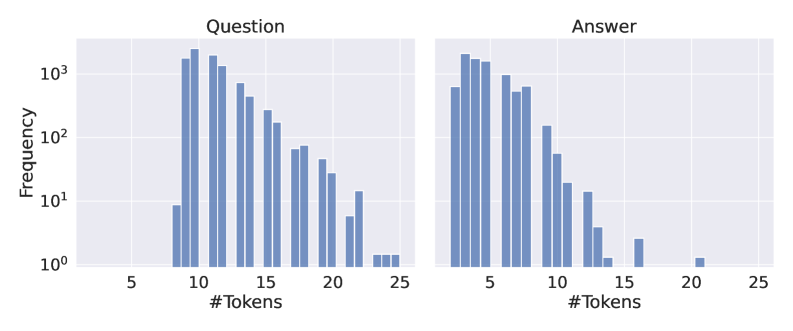
The image presents two histograms displayed side-by-side. Both histograms depict the frequency distribution of the number of tokens in a dataset. The left histogram represents the distribution for "Question" data, and the right histogram represents the distribution for "Answer" data. Both histograms use the same scale for the y-axis (Frequency) and x-axis (#Tokens).
### Components/Axes
* **X-axis Label:** "#Tokens" - Represents the number of tokens. The scale ranges from approximately 5 to 25.
* **Y-axis Label:** "Frequency" - Represents the number of occurrences. The scale is logarithmic, ranging from 1 to approximately 1000.
* **Title (Left):** "Question" - Indicates the histogram represents token counts in questions.
* **Title (Right):** "Answer" - Indicates the histogram represents token counts in answers.
* **Histogram Bars:** Blue bars representing the frequency of each token count.
### Detailed Analysis
**Question Histogram:**
The "Question" histogram shows a roughly normal distribution, peaking around 10-12 tokens. The frequency decreases as the number of tokens moves away from the peak in both directions.
* Approximately 5 tokens: Frequency ~ 10
* Approximately 8 tokens: Frequency ~ 50
* Approximately 10 tokens: Frequency ~ 900
* Approximately 12 tokens: Frequency ~ 700
* Approximately 14 tokens: Frequency ~ 400
* Approximately 16 tokens: Frequency ~ 200
* Approximately 18 tokens: Frequency ~ 80
* Approximately 20 tokens: Frequency ~ 30
* Approximately 22 tokens: Frequency ~ 10
* Approximately 24 tokens: Frequency ~ 2
**Answer Histogram:**
The "Answer" histogram also shows a distribution peaking around 8-10 tokens, but it decays more rapidly than the "Question" histogram.
* Approximately 5 tokens: Frequency ~ 10
* Approximately 7 tokens: Frequency ~ 100
* Approximately 9 tokens: Frequency ~ 800
* Approximately 11 tokens: Frequency ~ 500
* Approximately 13 tokens: Frequency ~ 200
* Approximately 15 tokens: Frequency ~ 50
* Approximately 17 tokens: Frequency ~ 10
* Approximately 19 tokens: Frequency ~ 3
* Approximately 21 tokens: Frequency ~ 1
* Approximately 23 tokens: Frequency ~ 1
### Key Observations
* Both distributions are right-skewed, meaning there are more shorter sequences than longer sequences.
* The peak of the "Question" histogram is slightly shifted to the right compared to the "Answer" histogram, suggesting questions tend to have slightly more tokens than answers.
* The "Question" histogram has a longer tail, indicating a greater number of questions with a higher token count compared to answers.
* The logarithmic scale on the y-axis emphasizes the differences in frequency at lower token counts.
### Interpretation
The data suggests that both questions and answers in this dataset tend to be relatively short, with most falling within the range of 5 to 20 tokens. However, questions exhibit a wider range of token counts, with a non-negligible number of questions exceeding 20 tokens, while answers are more concentrated in the lower token count range. This could indicate that questions are more open-ended and require more context, while answers are typically concise and direct. The logarithmic scale highlights the prevalence of shorter sequences, suggesting that the dataset is dominated by short questions and answers. The difference in the distributions could be a characteristic of the dataset itself, or it could reflect the nature of the task or domain from which the data was collected. Further investigation into the dataset's source and characteristics would be needed to draw more definitive conclusions.