## Diagram: 4x4 State Transition or Computational Grid
### Overview
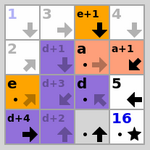
The image displays a 4x4 grid or matrix. Each cell contains a combination of alphanumeric text, mathematical expressions, directional arrows, and/or star symbols. Several cells have distinct background colors (orange, purple, blue). The diagram appears to represent a state space, computational grid, or transition table, where cells contain values or expressions and arrows indicate possible movements or operations.
### Components/Axes
* **Grid Structure:** A 4x4 matrix with 16 cells.
* **Cell Content:** Each cell contains one or more of the following:
* **Numbers:** `1`, `2`, `3`, `4`, `5`, `16`.
* **Letters/Variables:** `a`, `d`, `e`.
* **Expressions:** `a+1`, `d+1`, `d+2`, `d+3`, `d+4`, `e+1`.
* **Directional Arrows:** Black or gray arrows pointing in eight possible directions (up, down, left, right, and the four diagonals).
* **Star Symbol:** A black five-pointed star (`★`).
* **Color Coding:** Cells have solid background colors:
* **Orange:** Cells containing `e+1`, `a`, `a+1`, `e`.
* **Purple:** Cells containing `d+1`, `d+3`, `d`, `d+4`, `d+2`.
* **Blue:** The cell containing `16`.
* **Light Gray/White:** All other cells (`1`, `2`, `3`, `4`, `5`, `1`).
### Detailed Analysis
**Cell-by-Cell Content (Row-major order, top-left to bottom-right):**
1. **Row 1, Column 1 (Top-Left):** Light gray background. Text: `1`. No arrow.
2. **Row 1, Column 2:** Light gray background. Text: `3`. Gray arrow pointing down (`↓`).
3. **Row 1, Column 3:** Orange background. Text: `e+1`. Black arrow pointing down (`↓`).
4. **Row 1, Column 4 (Top-Right):** Light gray background. Text: `4`. Gray arrow pointing down (`↓`).
5. **Row 2, Column 1:** Light gray background. Text: `2`. No arrow.
6. **Row 2, Column 2:** Purple background. Text: `d+1`. Gray arrow pointing right (`→`).
7. **Row 2, Column 3:** Orange background. Text: `a`. Black arrow pointing right (`→`).
8. **Row 2, Column 4:** Orange background. Text: `a+1`. Black arrow pointing diagonally up-right (`↗`).
9. **Row 3, Column 1:** Orange background. Text: `e`. Black arrow pointing right (`→`).
10. **Row 3, Column 2:** Purple background. Text: `d+3`. Black arrow pointing diagonally up-right (`↗`).
11. **Row 3, Column 3:** Purple background. Text: `d`. Black arrow pointing left (`←`).
12. **Row 3, Column 4:** Light gray background. Text: `5`. Black star (`★`).
13. **Row 4, Column 1 (Bottom-Left):** Purple background. Text: `d+4`. Black arrow pointing right (`→`).
14. **Row 4, Column 2:** Purple background. Text: `d+2`. Black arrow pointing diagonally up-right (`↗`).
15. **Row 4, Column 3:** Light gray background. Text: `1`. Black star (`★`).
16. **Row 4, Column 4 (Bottom-Right):** Blue background. Text: `16`. Black star (`★`).
### Key Observations
1. **Color-Content Correlation:** Orange cells contain variables `a` and `e` or their increments. Purple cells contain the variable `d` or its increments. The single blue cell contains the highest number (`16`).
2. **Arrow Patterns:** Arrows are present in 12 of 16 cells. Their directions are varied, with no single uniform flow. Cells with stars (`5`, `1`, `16`) do not have arrows.
3. **Star Symbol Placement:** Stars appear in three cells: `5` (R3,C4), `1` (R4,C3), and `16` (R4,C4). These may denote terminal states, goal states, or special values.
4. **Numerical Values:** Numbers present are `1`, `2`, `3`, `4`, `5`, `16`. The number `1` appears twice (R1,C1 and R4,C3). `16` is the largest value and is uniquely colored blue.
5. **Expressions:** All expressions are simple increments of a base variable (`a+1`, `d+1`, `d+2`, `d+3`, `d+4`, `e+1`).
### Interpretation
This diagram likely represents a **state transition diagram for a grid-based algorithm or puzzle**. The cells are states, and the arrows indicate permissible moves or operations from one state to another.
* **Variables as State Descriptors:** The letters `a`, `d`, and `e` likely represent parameters, coordinates, or state identifiers. The expressions (e.g., `d+3`) suggest states derived from a base value.
* **Color as State Type:** The color coding groups states by their underlying variable (`a/e` in orange, `d` in purple), suggesting different categories or phases within the system. The unique blue cell for `16` marks it as a distinct, possibly final or target, state.
* **Flow and Termination:** The arrows show a complex, non-linear flow between states. The absence of arrows from cells with stars (`5`, `1`, `16`) strongly implies these are **absorbing or terminal states**. The system's process ends upon reaching any of these cells.
* **Possible Context:** This could be a visual representation of a dynamic programming table, a pathfinding algorithm's state space, a puzzle solution map (like a sliding tile puzzle), or a finite state machine. The grid layout and directional arrows are characteristic of spatial or sequential decision processes. The presence of both numbers and variable expressions suggests it models a process where states can be defined both by fixed values and by computed relationships.