## Line Chart: Accuracy vs. Thinking Compute
### Overview
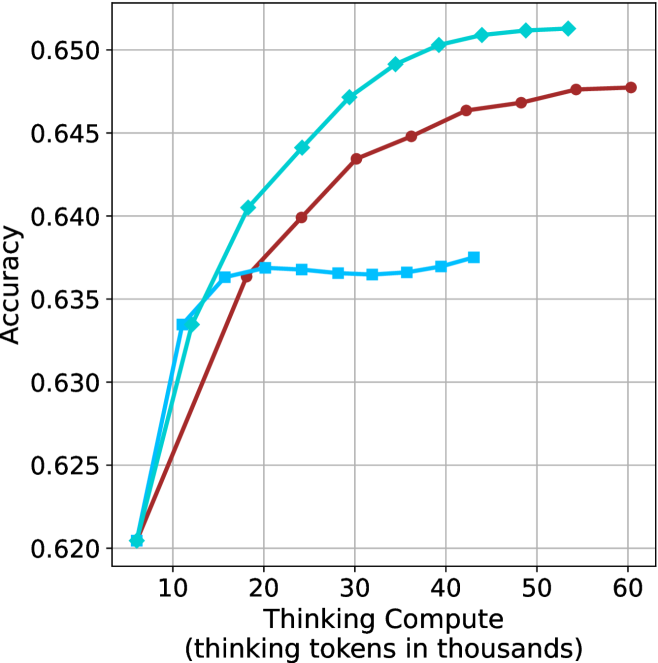
The image is a line chart comparing the accuracy of three different models as a function of "Thinking Compute" (measured in thousands of tokens). The x-axis represents the amount of compute, ranging from approximately 5,000 to 60,000 tokens. The y-axis represents accuracy, ranging from 0.620 to 0.650. Three distinct lines, each representing a different model, are plotted on the chart.
### Components/Axes
* **X-axis:** "Thinking Compute (thinking tokens in thousands)". The axis ranges from 0 to 60, with tick marks at intervals of 10.
* **Y-axis:** "Accuracy". The axis ranges from 0.620 to 0.650, with tick marks at intervals of 0.005.
* **Data Series:** Three data series are plotted, each represented by a different color and marker:
* **Light Blue (Diamond markers):** This line generally slopes upward, indicating increasing accuracy with increasing compute.
* **Brown (Circle markers):** This line also slopes upward, but appears to plateau at higher compute values.
* **Light Blue (Square markers):** This line remains relatively flat after an initial increase, suggesting minimal improvement in accuracy with increasing compute beyond a certain point.
### Detailed Analysis
**Light Blue (Diamond markers):**
* At 8, the accuracy is approximately 0.620.
* At 20, the accuracy is approximately 0.641.
* At 30, the accuracy is approximately 0.647.
* At 40, the accuracy is approximately 0.651.
* At 50, the accuracy is approximately 0.652.
* At 60, the accuracy is approximately 0.652.
* Trend: The line slopes upward, indicating increasing accuracy with increasing compute.
**Brown (Circle markers):**
* At 8, the accuracy is approximately 0.620.
* At 20, the accuracy is approximately 0.637.
* At 30, the accuracy is approximately 0.644.
* At 40, the accuracy is approximately 0.646.
* At 50, the accuracy is approximately 0.648.
* At 60, the accuracy is approximately 0.648.
* Trend: The line slopes upward, but appears to plateau at higher compute values.
**Light Blue (Square markers):**
* At 8, the accuracy is approximately 0.620.
* At 20, the accuracy is approximately 0.637.
* At 30, the accuracy is approximately 0.637.
* At 40, the accuracy is approximately 0.638.
* Trend: The line remains relatively flat after an initial increase, suggesting minimal improvement in accuracy with increasing compute beyond a certain point.
### Key Observations
* The light blue line with diamond markers consistently achieves the highest accuracy across all compute values.
* The brown line with circle markers shows a similar initial increase in accuracy to the light blue line, but plateaus at a lower accuracy level.
* The light blue line with square markers plateaus early, indicating that increasing compute does not significantly improve its accuracy.
* All three models start at approximately the same accuracy level (0.620) with minimal compute.
### Interpretation
The chart demonstrates the relationship between "Thinking Compute" and the accuracy of three different models. The light blue line with diamond markers appears to be the most effective model, as it consistently achieves the highest accuracy with increasing compute. The brown line with circle markers shows diminishing returns with increasing compute, while the light blue line with square markers plateaus early, suggesting it is not well-suited for higher compute values. The data suggests that the choice of model significantly impacts the accuracy achieved for a given amount of compute. The initial convergence of all models at low compute suggests a baseline level of performance, with the models diverging as compute increases, highlighting their varying capabilities.