## Line Chart: Accuracy vs. Thinking Compute
### Overview
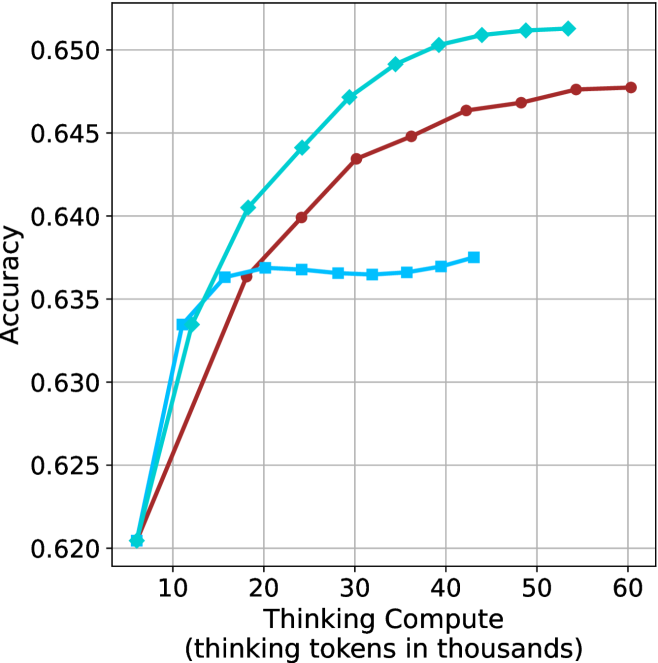
The image is a line chart illustrating the relationship between "Thinking Compute" (measured in thousands of thinking tokens) and model "Accuracy." The chart displays three distinct data series, all originating from a common starting point. There is no legend provided in the image to identify the specific models or configurations represented by the lines.
### Components/Axes
* **Y-Axis:** Labeled "Accuracy." The scale ranges from 0.620 to 0.650, with major grid lines at intervals of 0.005.
* **X-Axis:** Labeled "Thinking Compute (thinking tokens in thousands)." The scale ranges from 10 to 60, with major grid lines at intervals of 10. The origin point appears to be approximately 6.5.
* **Data Series:**
* **Series A (Dark Red/Maroon):** Circular markers.
* **Series B (Cyan/Light Blue):** Diamond markers.
* **Series C (Cyan/Light Blue):** Square markers.
* **Grid:** A standard Cartesian grid is overlaid on the plot area.
### Detailed Analysis
All three series originate at approximately **(6.5, 0.6205)**.
#### Series A (Dark Red, Circular Markers)
* **Trend:** This series shows a steady, monotonic upward slope. The rate of improvement decreases as compute increases, indicating diminishing returns.
* **Data Points (Approximate):**
* (12, 0.633)
* (24, 0.640)
* (30, 0.6435)
* (36, 0.645)
* (42, 0.6465)
* (48, 0.647)
* (54, 0.6475)
* (60, 0.6475)
#### Series B (Cyan, Diamond Markers)
* **Trend:** This series exhibits the steepest upward trajectory and achieves the highest overall accuracy. It continues to climb throughout the observed range.
* **Data Points (Approximate):**
* (12, 0.6335)
* (18, 0.6405)
* (24, 0.644)
* (30, 0.647)
* (36, 0.649)
* (42, 0.650)
* (48, 0.6505)
* (54, 0.6505)
#### Series C (Cyan, Square Markers)
* **Trend:** This series initially tracks closely with the Diamond series but diverges significantly after approximately 16k tokens. It enters a plateau phase where accuracy remains stagnant, followed by a very slight recovery at higher compute levels.
* **Data Points (Approximate):**
* (12, 0.6335)
* (16, 0.6365)
* (20, 0.6368)
* (24, 0.6368)
* (28, 0.6365)
* (32, 0.6365)
* (36, 0.6365)
* (40, 0.637)
* (44, 0.6375)
### Key Observations
* **Divergence Point:** All three models perform identically up to approximately 12k tokens. After this point, the strategies diverge sharply.
* **Performance Ceiling:** The Square-marker series (Series C) hits a clear performance ceiling or saturation point around 16k tokens, suggesting that additional compute beyond this point provides almost no benefit for this specific configuration.
* **Efficiency:** The Diamond-marker series (Series B) is the most efficient, maintaining a higher slope for longer and reaching the highest accuracy (approx. 0.6505).
* **Consistency:** The Red-marker series (Series A) represents a middle-ground performance, consistently outperforming the Square-marker series but failing to match the Diamond-marker series.
### Interpretation
This chart demonstrates the impact of "thinking compute" on model accuracy, likely comparing different inference-time scaling strategies or model architectures.
* **The "Square" Strategy:** This appears to be a configuration that is highly sensitive to compute limits or suffers from a bottleneck. Once it hits ~16k tokens, it stops learning or improving, suggesting that the model architecture or the specific "thinking" process is not capable of utilizing additional compute effectively.
* **The "Diamond" Strategy:** This represents the most robust scaling behavior. It successfully converts additional compute into accuracy gains across the entire range, suggesting a more scalable "thinking" process.
* **The "Red" Strategy:** This represents a stable, reliable scaling method. While it does not reach the peak accuracy of the Diamond strategy, it avoids the hard plateau seen in the Square strategy, making it a predictable, albeit slower, scaling option.
In summary, the data suggests that the choice of "thinking" strategy is critical; simply adding more compute (tokens) is not a guarantee of improved accuracy, as evidenced by the plateauing of the Square-marker series.