## Line Chart: Step Length vs Reasoning Tokens for Four Shot Easy Blocksworld
### Overview
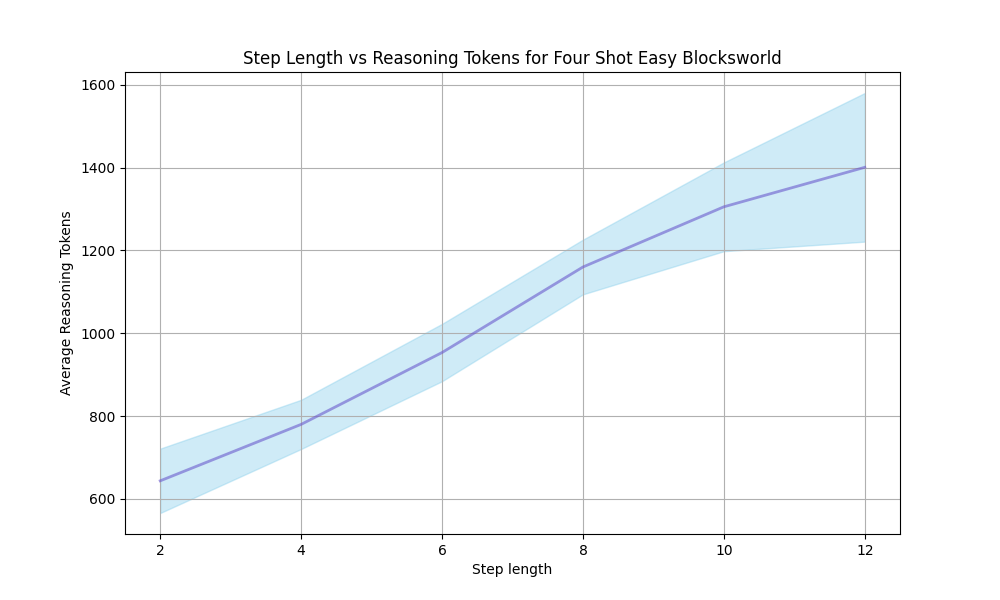
The chart illustrates the relationship between step length (x-axis) and average reasoning tokens (y-axis) for a four-shot easy Blocksworld task. A single data series is represented by a solid purple line with a light blue shaded area indicating variability or confidence intervals. The trend shows a consistent upward trajectory as step length increases.
### Components/Axes
- **Title**: "Step Length vs Reasoning Tokens for Four Shot Easy Blocksworld"
- **X-axis (Step length)**:
- Labels: 2, 4, 6, 8, 10, 12
- Scale: Linear increments of 2
- **Y-axis (Average Reasoning Tokens)**:
- Labels: 600, 800, 1000, 1200, 1400, 1600
- Scale: Linear increments of 200
- **Legend**:
- Position: Top-right
- Label: "Average Reasoning Tokens" (matches line color)
- Shaded area: Light blue (200 tokens below the line)
### Detailed Analysis
- **Data Series**:
- **Line**: Solid purple, starts at (2, 650) and ends at (12, 1400).
- **Shaded Area**: Light blue, spans from 200 tokens below the line to the line itself.
- **Key Data Points**:
- Step 2: 650 tokens (line), 550 tokens (lower bound)
- Step 4: 780 tokens (line), 580 tokens (lower bound)
- Step 6: 950 tokens (line), 750 tokens (lower bound)
- Step 8: 1150 tokens (line), 950 tokens (lower bound)
- Step 10: 1300 tokens (line), 1100 tokens (lower bound)
- Step 12: 1400 tokens (line), 1200 tokens (lower bound)
- **Trend**:
- Line slopes upward at a roughly linear rate (~100 tokens per 2-step increase).
- Shaded area widens as step length increases, suggesting greater variability in reasoning tokens for longer steps.
### Key Observations
1. **Consistent Growth**: The line shows a steady increase in reasoning tokens with step length.
2. **Variability**: The shaded area expands at higher step lengths, indicating increased uncertainty or dispersion in token usage.
3. **Bounds**: The lower bound of the shaded area remains consistently 200 tokens below the line across all steps.
### Interpretation
The chart suggests that longer step lengths in the Blocksworld task correlate with higher average reasoning token requirements. The widening shaded area at larger step lengths implies that variability in reasoning complexity or computational demands increases with step length. This could reflect challenges in maintaining consistent performance or resource allocation as tasks become more extended. The fixed 200-token gap between the line and shaded area lower bound may represent a baseline threshold for reasoning efficiency.