## Bar Chart: Shifter - Time vs Core Count
### Overview
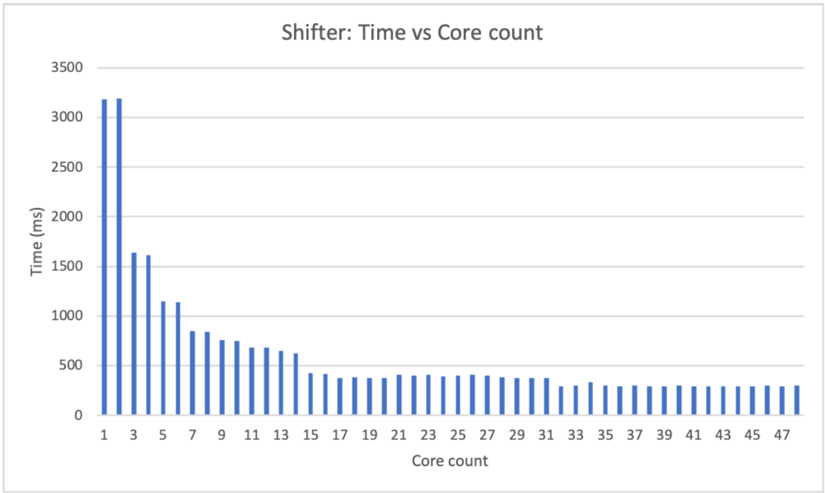
The image is a bar chart titled "Shifter: Time vs Core count". It shows the relationship between the number of cores used and the time taken (in milliseconds). The x-axis represents the core count, ranging from 1 to 47. The y-axis represents the time in milliseconds, ranging from 0 to 3500. The chart displays a trend where the time taken decreases as the core count increases, eventually leveling off.
### Components/Axes
* **Title:** Shifter: Time vs Core count
* **X-axis:**
* Label: Core count
* Scale: 1, 3, 5, 7, 9, 11, 13, 15, 17, 19, 21, 23, 25, 27, 29, 31, 33, 35, 37, 39, 41, 43, 45, 47
* **Y-axis:**
* Label: Time (ms)
* Scale: 0, 500, 1000, 1500, 2000, 2500, 3000, 3500
* **Data Series:** The chart contains one data series represented by blue bars.
### Detailed Analysis
The data series shows a decreasing trend in time (ms) as the core count increases.
* **Core Count 1:** Time is approximately 3200 ms.
* **Core Count 3:** Time is approximately 1600 ms.
* **Core Count 5:** Time is approximately 1600 ms.
* **Core Count 7:** Time is approximately 1100 ms.
* **Core Count 9:** Time is approximately 800 ms.
* **Core Count 11:** Time is approximately 750 ms.
* **Core Count 13:** Time is approximately 650 ms.
* **Core Count 15:** Time is approximately 500 ms.
* **Core Count 17:** Time is approximately 400 ms.
* **Core Count 19:** Time is approximately 400 ms.
* **Core Count 21:** Time is approximately 400 ms.
* **Core Count 23:** Time is approximately 400 ms.
* **Core Count 25:** Time is approximately 350 ms.
* **Core Count 27:** Time is approximately 350 ms.
* **Core Count 29:** Time is approximately 350 ms.
* **Core Count 31:** Time is approximately 350 ms.
* **Core Count 33:** Time is approximately 300 ms.
* **Core Count 35:** Time is approximately 300 ms.
* **Core Count 37:** Time is approximately 300 ms.
* **Core Count 39:** Time is approximately 300 ms.
* **Core Count 41:** Time is approximately 300 ms.
* **Core Count 43:** Time is approximately 300 ms.
* **Core Count 45:** Time is approximately 300 ms.
* **Core Count 47:** Time is approximately 300 ms.
### Key Observations
* The most significant drop in time occurs between 1 and 3 cores.
* After approximately 31 cores, the time taken plateaus around 300 ms.
* There is a diminishing return in time reduction as the core count increases beyond a certain point.
### Interpretation
The chart demonstrates the impact of increasing core count on the execution time of the "Shifter" process. Initially, adding more cores significantly reduces the execution time. However, as the core count increases, the reduction in time becomes less pronounced, indicating a point of diminishing returns. This suggests that there is an optimal core count beyond which adding more cores does not significantly improve performance, possibly due to overhead or other limiting factors. The data implies that for this specific "Shifter" process, using more than 31 cores provides minimal benefit in terms of reducing execution time.