TECHNICAL ASSET FINGERPRINT
41e5eb0ab01b94a6bd3dba55
Click to view fullscreen
Press ESC or click to close
FOUND IN PAPERS
EXPERT: gemini-2.5-flash-free VERSION 1
RUNTIME: google-free/gemini-2.5-flash
INTEL_VERIFIED
## Chart Type: Mean Pass Rate vs. Mean Number of Tokens Generated
### Overview
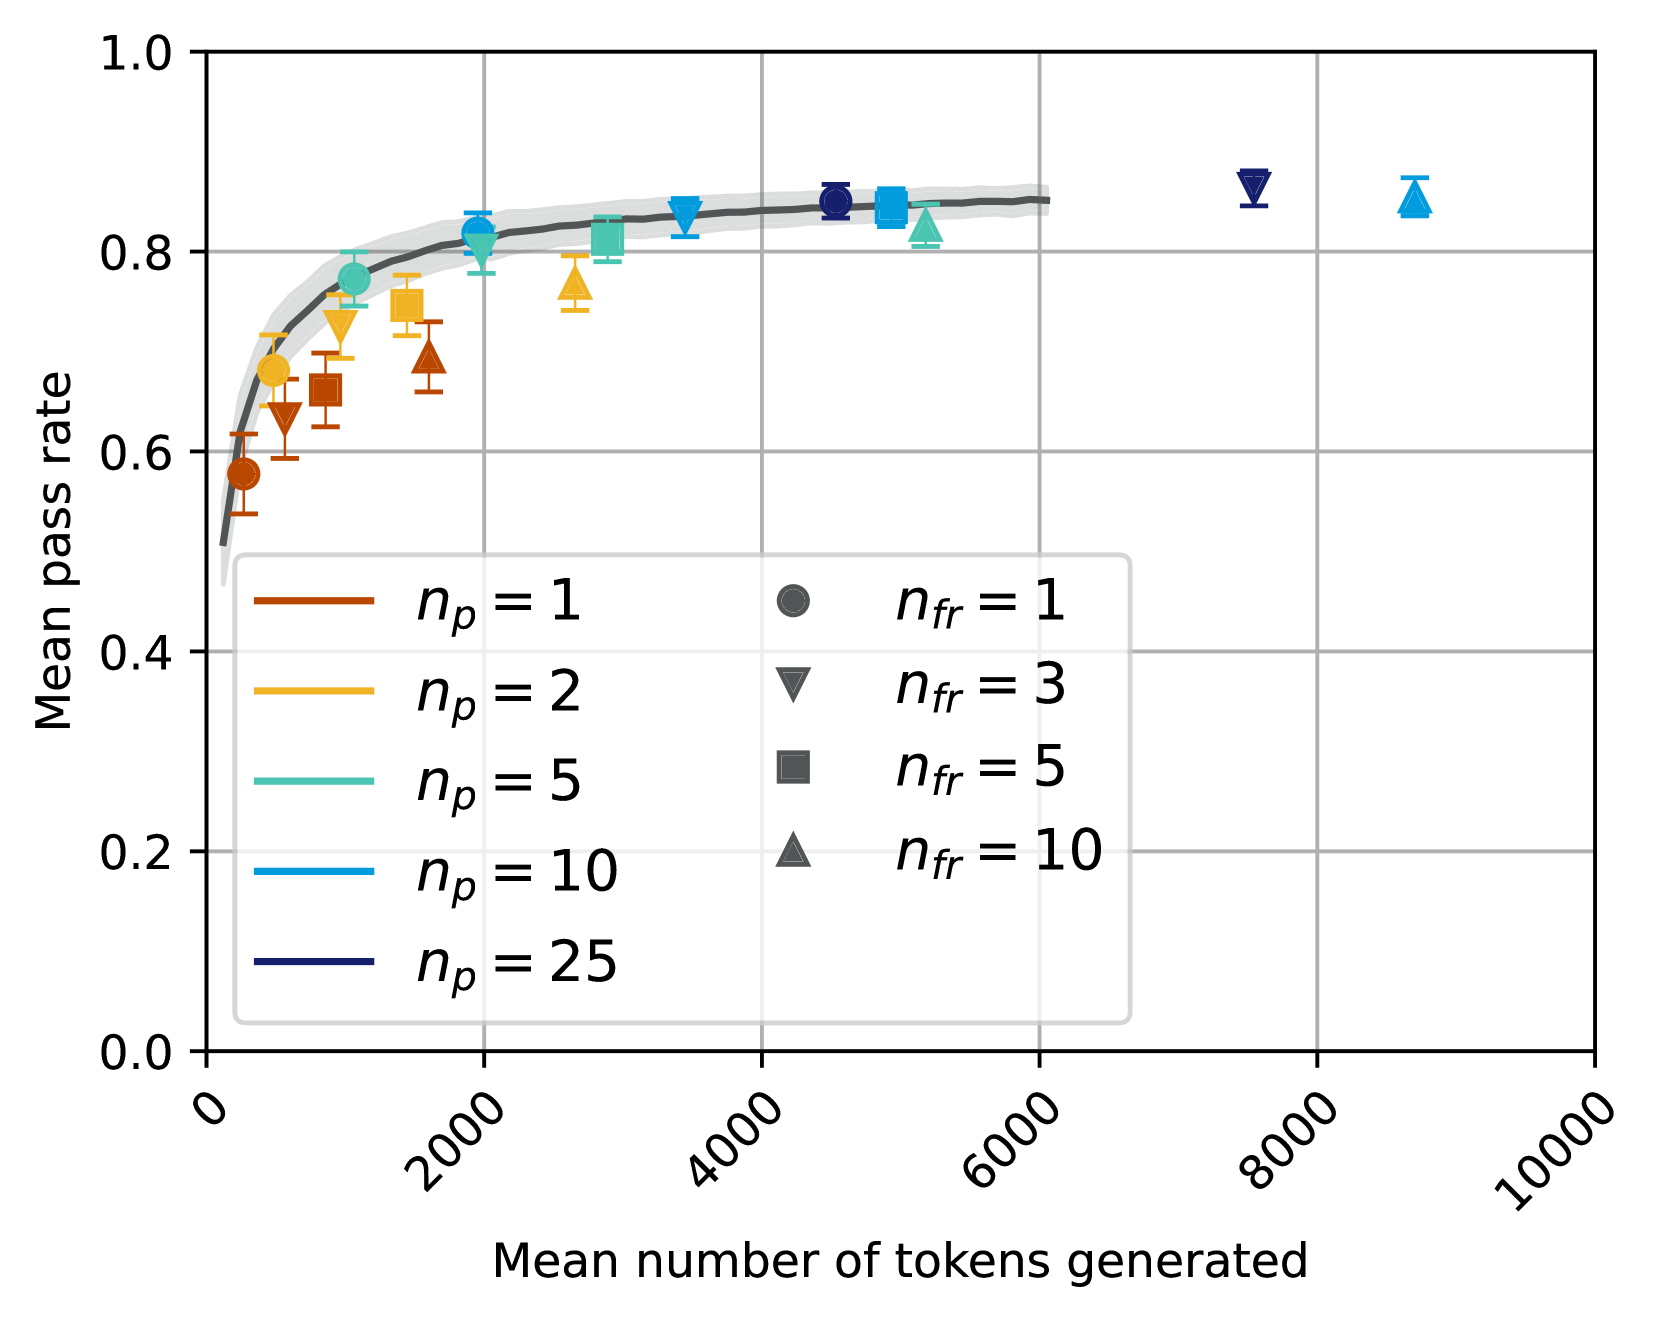
This image displays a scatter plot illustrating the relationship between the "Mean number of tokens generated" on the x-axis and the "Mean pass rate" on the y-axis. The data points are categorized by two parameters: `n_p` (represented by color) and `n_fr` (represented by marker shape). A dark grey fitted curve with a lighter grey confidence interval is overlaid on the data, showing the general trend. Each data point includes vertical error bars indicating uncertainty in the mean pass rate.
### Components/Axes
The chart is structured with a primary plotting area, an x-axis at the bottom, a y-axis on the left, and a legend positioned in the bottom-left to center-right area.
* **X-axis (Bottom)**:
* **Title**: "Mean number of tokens generated"
* **Range**: From 0 to 10000.
* **Major Ticks and Labels**: 0, 2000, 4000, 6000, 8000, 10000. The labels are rotated approximately 45 degrees counter-clockwise.
* **Y-axis (Left)**:
* **Title**: "Mean pass rate"
* **Range**: From 0.0 to 1.0.
* **Major Ticks and Labels**: 0.0, 0.2, 0.4, 0.6, 0.8, 1.0.
* **Legend (Bottom-left to Center-right)**: The legend is divided into two columns within a light grey rectangular box.
* **Left Column (Color mapping for `n_p`)**:
* Brown line: `n_p = 1`
* Orange line: `n_p = 2`
* Teal/Cyan line: `n_p = 5`
* Light Blue line: `n_p = 10`
* Dark Blue line: `n_p = 25`
* **Right Column (Marker shape mapping for `n_fr`)**:
* Dark Grey circle: `n_fr = 1`
* Dark Grey downward triangle: `n_fr = 3`
* Dark Grey square: `n_fr = 5`
* Dark Grey upward triangle: `n_fr = 10`
* **Fitted Curve**: A thick, solid dark grey line represents the overall trend. It is surrounded by a lighter grey shaded area, indicating a confidence interval or standard deviation for the fit.
### Detailed Analysis
The chart displays 20 data points, each characterized by a specific `n_p` value (color), `n_fr` value (marker shape), mean number of tokens generated (x-coordinate), and mean pass rate (y-coordinate), along with vertical error bars.
**Overall Trend of Fitted Curve**:
The dark grey fitted curve shows a rapid increase in "Mean pass rate" as "Mean number of tokens generated" increases from 0 to approximately 2000. Beyond 2000 tokens, the rate of increase slows significantly, and the curve appears to plateau around a "Mean pass rate" of 0.84 to 0.85 for token counts between 4000 and 6000. The confidence interval (light grey shading) is relatively narrow across the observed range.
**Data Points by `n_p` (Color) and `n_fr` (Marker Shape)**:
1. **`n_p = 1` (Brown colored points)**:
* `n_fr = 1` (Circle):
* Approx. (550 tokens, 0.58 pass rate), error bar from ~0.56 to ~0.60.
* Approx. (1000 tokens, 0.65 pass rate), error bar from ~0.63 to ~0.67.
* `n_fr = 3` (Downward Triangle):
* Approx. (1200 tokens, 0.68 pass rate), error bar from ~0.66 to ~0.70.
* `n_fr = 5` (Square):
* Approx. (1500 tokens, 0.70 pass rate), error bar from ~0.68 to ~0.72.
* `n_fr = 10` (Upward Triangle):
* Approx. (1800 tokens, 0.75 pass rate), error bar from ~0.73 to ~0.77.
* *Trend for `n_p=1`*: Pass rate increases steadily with tokens generated, from 0.58 to 0.75.
2. **`n_p = 2` (Orange/Gold colored points)**:
* `n_fr = 1` (Circle):
* Approx. (700 tokens, 0.65 pass rate), error bar from ~0.63 to ~0.67.
* `n_fr = 3` (Downward Triangle):
* Approx. (1400 tokens, 0.72 pass rate), error bar from ~0.70 to ~0.74.
* `n_fr = 5` (Square):
* Approx. (2200 tokens, 0.75 pass rate), error bar from ~0.73 to ~0.77.
* Approx. (3200 tokens, 0.77 pass rate), error bar from ~0.75 to ~0.79.
* `n_fr = 10` (Upward Triangle):
* Approx. (2800 tokens, 0.76 pass rate), error bar from ~0.74 to ~0.78.
* *Trend for `n_p=2`*: Pass rate increases with tokens generated, reaching up to 0.77. These points generally achieve higher pass rates than `n_p=1` for similar token counts.
3. **`n_p = 5` (Teal/Cyan colored points)**:
* `n_fr = 1` (Circle):
* Approx. (1200 tokens, 0.78 pass rate), error bar from ~0.76 to ~0.80.
* `n_fr = 3` (Downward Triangle):
* Approx. (2000 tokens, 0.82 pass rate), error bar from ~0.80 to ~0.84.
* `n_fr = 5` (Square):
* Approx. (4800 tokens, 0.83 pass rate), error bar from ~0.81 to ~0.85.
* `n_fr = 10` (Upward Triangle):
* Approx. (5200 tokens, 0.82 pass rate), error bar from ~0.80 to ~0.84.
* *Trend for `n_p=5`*: Pass rate increases to over 0.80, reaching the plateau region of the fitted curve.
4. **`n_p = 10` (Light Blue colored points)**:
* `n_fr = 1` (Circle):
* Approx. (1800 tokens, 0.83 pass rate), error bar from ~0.81 to ~0.85.
* `n_fr = 3` (Downward Triangle):
* Approx. (3000 tokens, 0.84 pass rate), error bar from ~0.82 to ~0.86.
* Approx. (7500 tokens, 0.87 pass rate), error bar from ~0.85 to ~0.89. (This point is significantly to the right of the main cluster and above the fitted curve's plateau.)
* `n_fr = 5` (Square):
* Approx. (4000 tokens, 0.85 pass rate), error bar from ~0.83 to ~0.87.
* `n_fr = 10` (Upward Triangle):
* Approx. (8500 tokens, 0.85 pass rate), error bar from ~0.83 to ~0.87. (This point is also significantly to the right of the main cluster and slightly above the fitted curve's plateau.)
* *Trend for `n_p=10`*: These points quickly reach the plateau region of the pass rate. Two points at very high token counts show slightly elevated pass rates compared to the main plateau.
5. **`n_p = 25` (Dark Blue colored points)**:
* `n_fr = 1` (Circle):
* Approx. (4500 tokens, 0.85 pass rate), error bar from ~0.83 to ~0.87.
* `n_fr = 3` (Downward Triangle):
* Approx. (5000 tokens, 0.84 pass rate), error bar from ~0.82 to ~0.86.
* *Trend for `n_p=25`*: These points are already in the plateau region, indicating high pass rates are achieved at moderate token counts.
### Key Observations
* **Diminishing Returns**: The "Mean pass rate" shows a clear trend of diminishing returns with increasing "Mean number of tokens generated." After approximately 4000 tokens, the pass rate improvement is minimal.
* **Impact of `n_p`**: Higher values of `n_p` (represented by darker blue colors) generally achieve higher "Mean pass rates" at lower "Mean number of tokens generated." For instance, `n_p=10` reaches a pass rate of ~0.83 at ~1800 tokens, while `n_p=1` only reaches ~0.75 at the same token count. This suggests `n_p` is a significant factor in the efficiency of achieving a high pass rate.
* **Impact of `n_fr`**: Within each `n_p` group, increasing `n_fr` (from circle to upward triangle) generally corresponds to higher token counts, often leading to slightly higher pass rates or maintaining high pass rates at increased token generation.
* **Outliers/High Token Count Behavior**: Two light blue points (`n_p=10`) at very high token counts (around 7500 and 8500) show "Mean pass rates" of approximately 0.87 and 0.85, respectively. These are slightly above the general plateau of the fitted curve, suggesting that for `n_p=10`, further token generation might yield marginal improvements or these represent specific conditions.
* **Error Bar Consistency**: The vertical error bars are consistently small across all data points, indicating a relatively low variability in the "Mean pass rate" for each configuration.
### Interpretation
The data strongly suggests that there is an optimal range for the "Mean number of tokens generated" to achieve a high "Mean pass rate." Generating tokens beyond approximately 4000-5000 provides very little additional benefit in terms of pass rate, indicating a point of diminishing returns or saturation.
The parameter `n_p` appears to be a critical factor influencing the efficiency of the process. Higher `n_p` values enable the system to reach a high pass rate with fewer tokens generated, implying that `n_p` might represent a measure of the model's capacity, search breadth, or inherent quality. A higher `n_p` allows for a more "powerful" or "effective" generation process, requiring less "effort" (fewer tokens) to achieve a desired outcome.
The parameter `n_fr` seems to fine-tune the generation process for a given `n_p`. As `n_fr` increases, the system tends to generate more tokens, potentially exploring more options or refining the output, which can lead to slightly higher pass rates or maintain high pass rates at increased computational cost.
The two outlying points for `n_p=10` at very high token counts are noteworthy. While the general trend shows a plateau, these points suggest that for specific configurations (like `n_p=10` with `n_fr=3` or `n_fr=10`), pushing token generation significantly further might still yield a slight, albeit marginal, increase in pass rate. This could indicate that for certain `n_p` values, the plateau is not absolute, or that these specific `n_fr` values unlock slightly better performance at extreme token generation costs. Further investigation into these specific configurations could reveal nuances in the system's behavior.
In summary, the chart highlights the importance of balancing computational cost (tokens generated) with performance (pass rate) and demonstrates that `n_p` is a key parameter for optimizing this trade-off, while `n_fr` offers further fine-tuning.
DECODING INTELLIGENCE...