## Bar Chart: Frequency of Token Counts in Dataset
### Overview
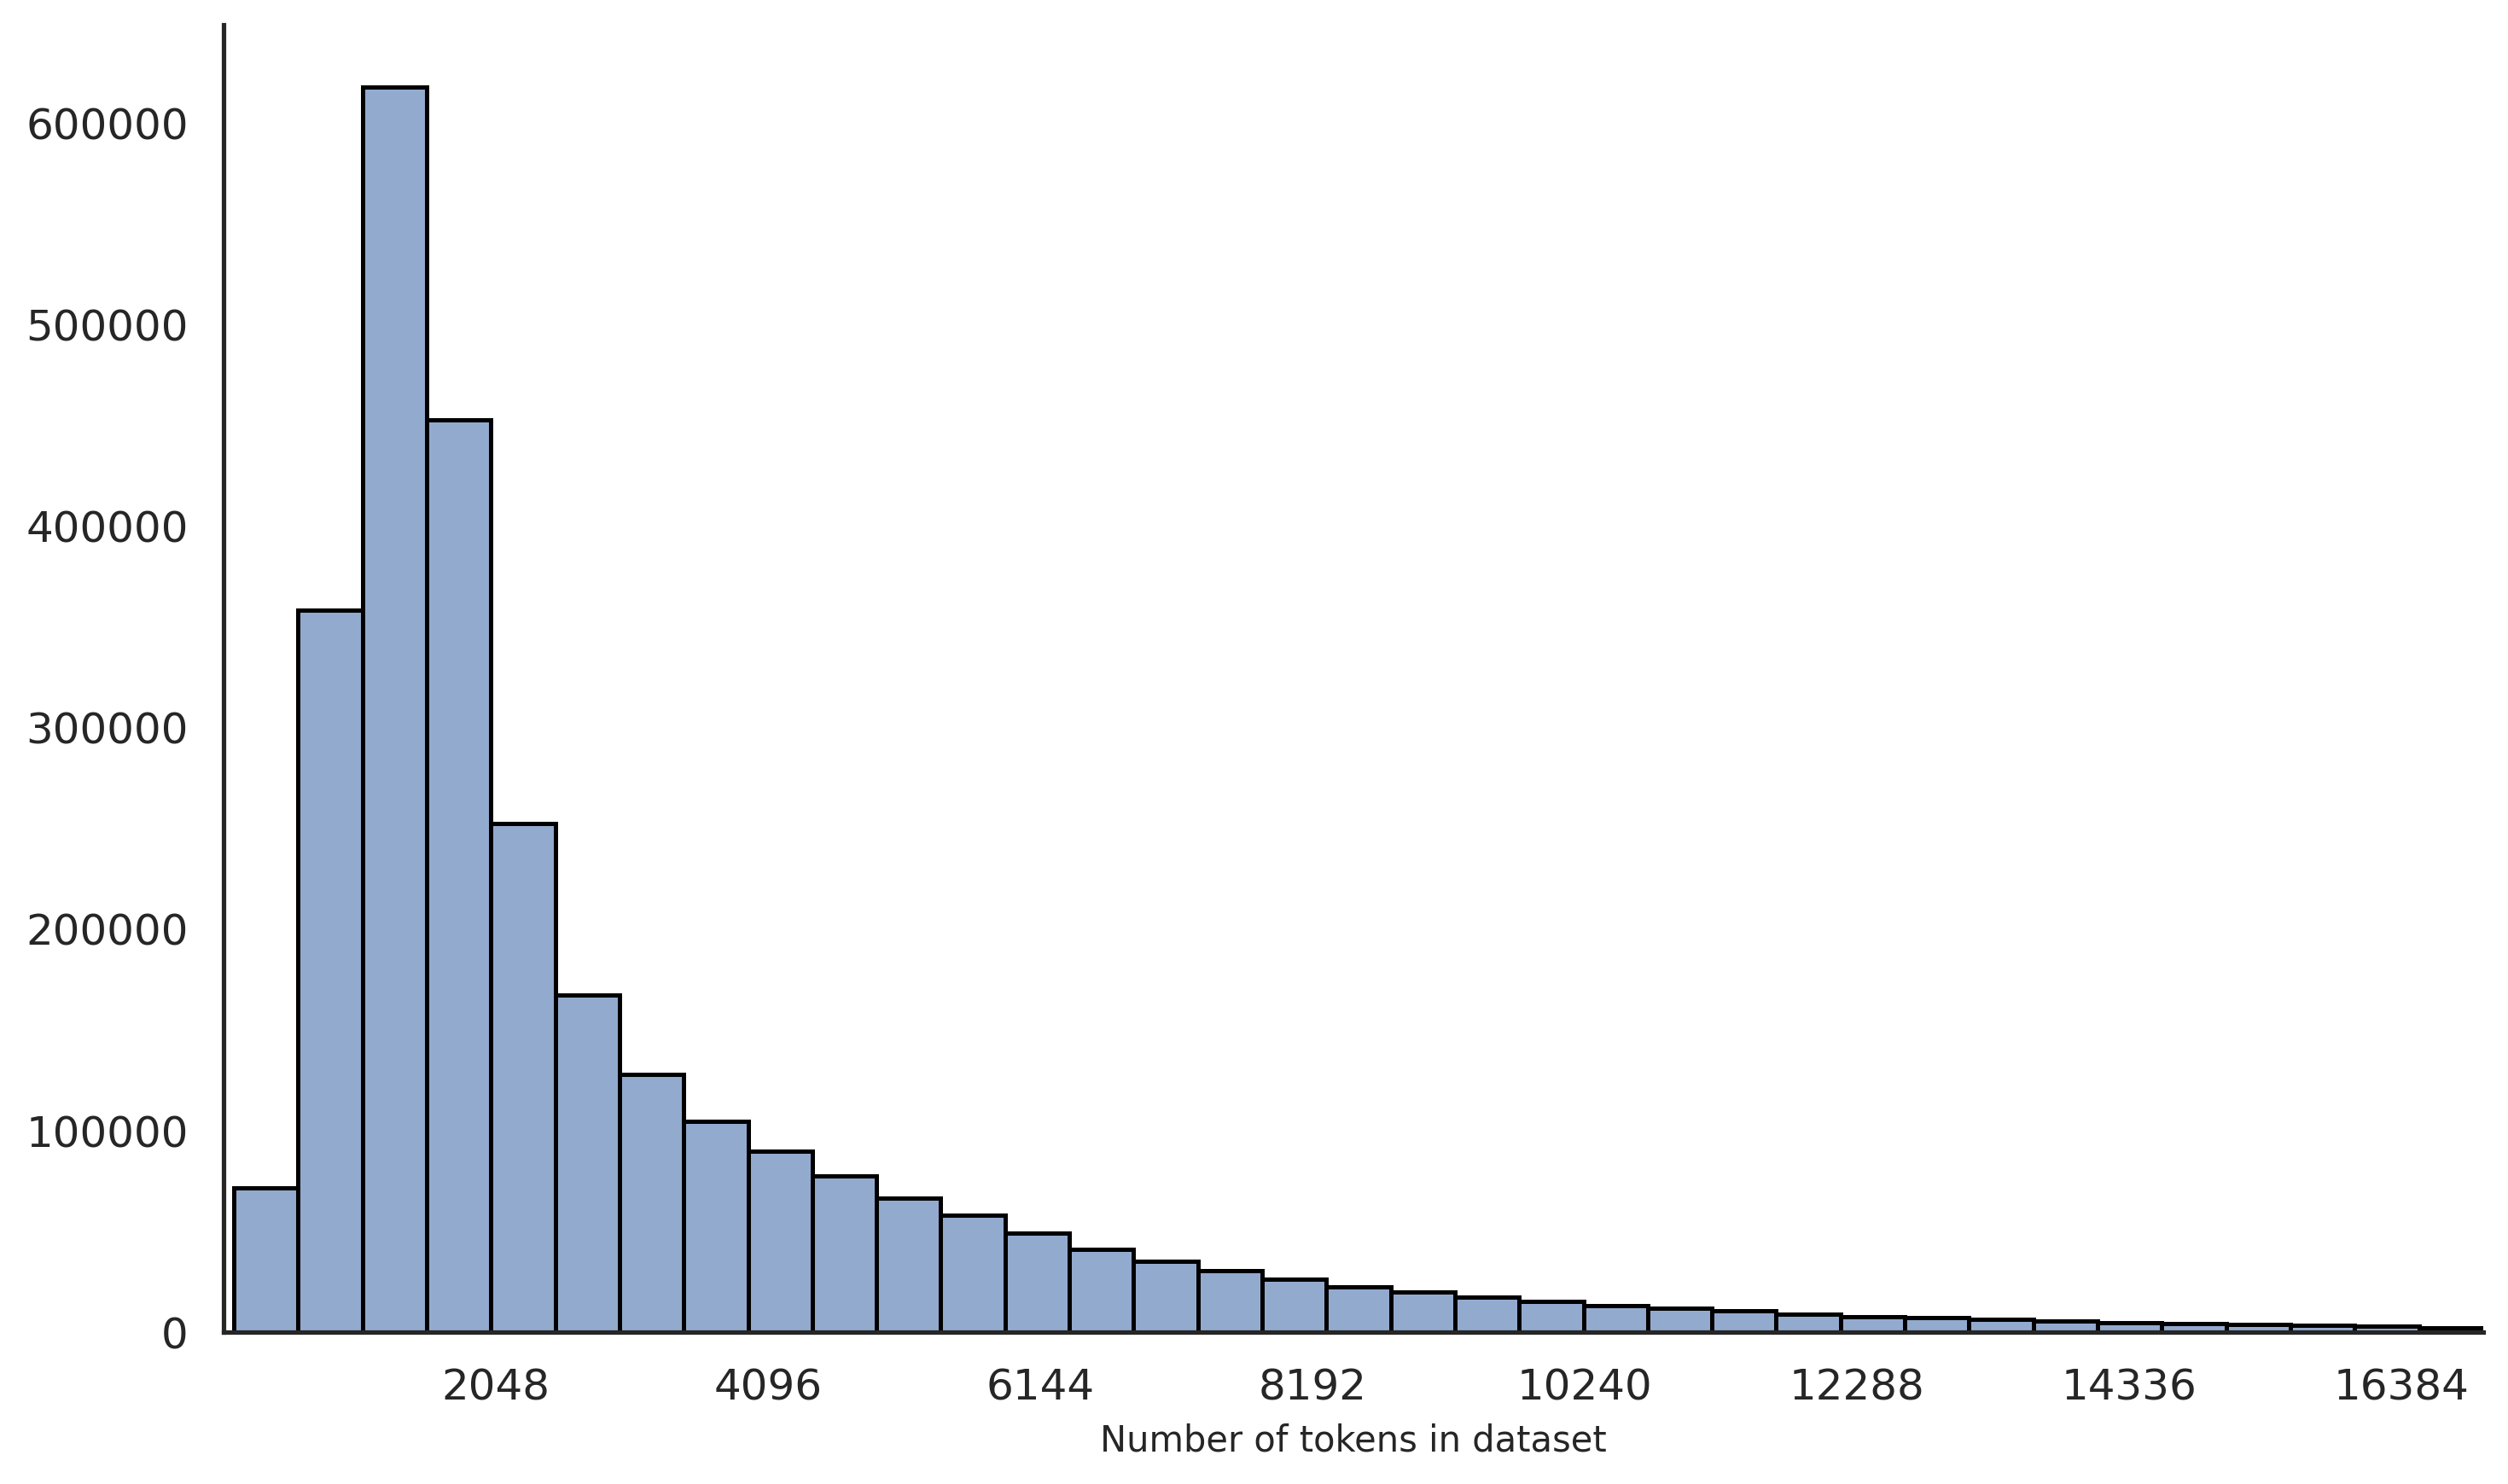
The chart displays a distribution of dataset sizes measured in "Number of tokens," with corresponding frequencies on the y-axis. The data shows a steep decline in frequency as token counts increase, indicating a concentration of smaller datasets.
### Components/Axes
- **X-axis (Number of tokens in dataset)**: Labeled with values 2048, 4096, 8192, 16384, and intermediate markers (e.g., 6144, 12288). The scale is logarithmic, with intervals doubling (e.g., 2048 → 4096 → 8192 → 16384).
- **Y-axis (Frequency)**: Labeled "Frequency" with a linear scale from 0 to 600,000 in increments of 100,000.
- **Bars**: Blue-colored vertical bars represent frequency counts. No explicit legend is visible, but the color is consistent across all bars.
### Detailed Analysis
- **2048 tokens**: Tallest bar, approximately **600,000** frequency.
- **4096 tokens**: Second tallest, approximately **450,000** frequency.
- **8192 tokens**: Third tallest, approximately **250,000** frequency.
- **16384 tokens**: Shortest visible bar, approximately **10,000** frequency.
- Intermediate values (e.g., 6144, 12288, 14336) show gradual declines, with frequencies dropping below 50,000 for token counts above 8192.
### Key Observations
1. **Skewed Distribution**: Over 90% of datasets have ≤8192 tokens, with the majority clustered at 2048 tokens.
2. **Long Tail**: Fewer datasets exist with higher token counts (e.g., 16384 tokens), forming a long tail.
3. **Rapid Decline**: Frequency drops by ~50% when token counts double (e.g., 2048 → 4096: 600k → 450k; 4096 → 8192: 450k → 250k).
### Interpretation
The data suggests a strong preference or constraint for smaller datasets in the analyzed collection. This could reflect:
- **Resource Limitations**: Smaller datasets may be easier to collect, store, or process.
- **Use Case Requirements**: Applications like lightweight NLP models or edge computing might prioritize compact data.
- **Data Collection Bias**: Larger datasets may be underrepresented due to sampling methods or domain-specific scarcity.
The logarithmic x-axis emphasizes the exponential growth in token counts, highlighting the disparity between small and large datasets. The absence of datasets beyond 16384 tokens (if any exist) could indicate a cutoff in the study or a natural upper limit in the data source.