## Line Chart: Pass@k (%) Performance Across Different Training Methods
### Overview
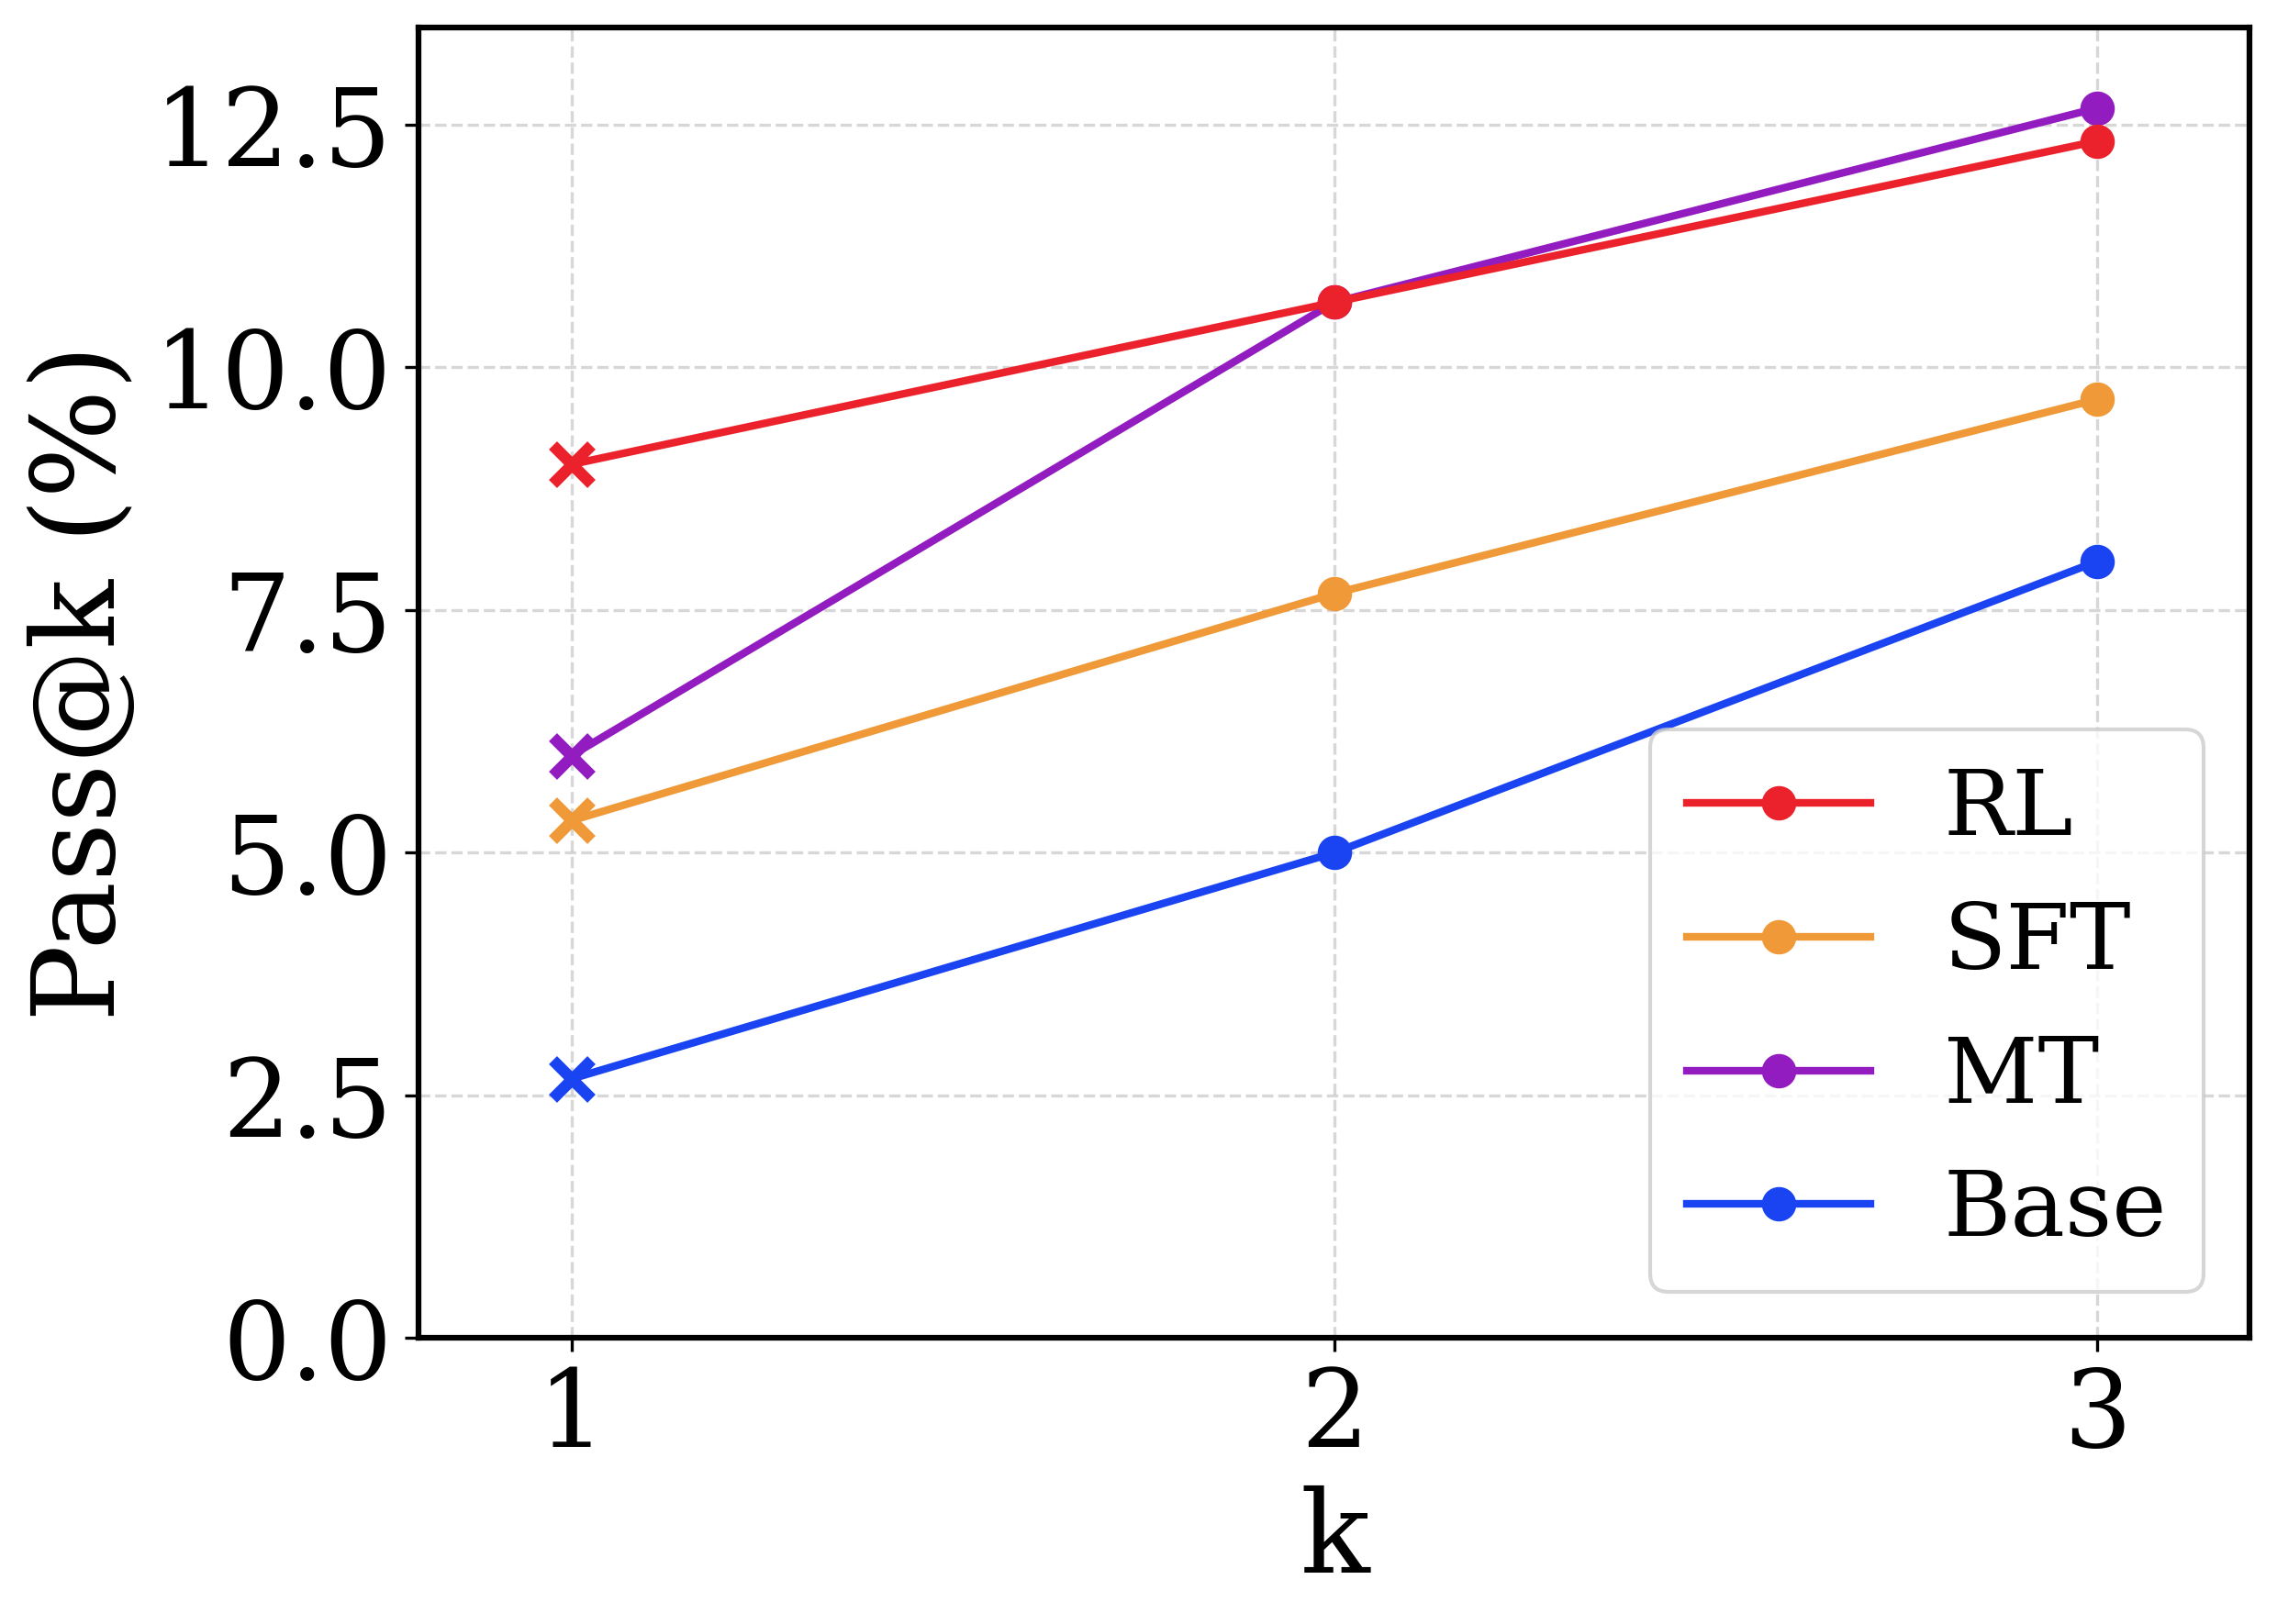
This image is a line chart displaying the performance metric "Pass@k (%)" on the y-axis against the variable "k" on the x-axis. It compares four different models or training methodologies, denoted by distinct colors. The chart demonstrates how the pass rate increases for all methods as the number of attempts ($k$) increases from 1 to 3.
### Components/Axes
**1. Y-Axis (Left side, vertical):**
* **Label:** "Pass@k (%)" (Rotated 90 degrees counter-clockwise).
* **Scale:** Linear, ranging from 0.0 to 12.5.
* **Markers/Tick Values:** 0.0, 2.5, 5.0, 7.5, 10.0, 12.5.
* **Gridlines:** Horizontal, light grey, dashed lines corresponding to each tick mark.
**2. X-Axis (Bottom, horizontal):**
* **Label:** "k" (Centered below the axis).
* **Scale:** Discrete integer values.
* **Markers/Tick Values:** 1, 2, 3.
* **Gridlines:** Vertical, light grey, dashed lines corresponding to each tick mark.
**3. Legend (Bottom-right quadrant, inside the chart area):**
* Enclosed in a rounded rectangular box with a light grey border.
* Lists four categories, each associated with a specific line color and a circular marker.
* **Red line with circle:** RL
* **Orange line with circle:** SFT
* **Purple line with circle:** MT
* **Blue line with circle:** Base
*Note on Markers:* While the legend displays circular markers for all entries, the actual data points on the chart use an 'x' marker at $k=1$ and a solid circular marker at $k=2$ and $k=3$.
### Detailed Analysis
**Trend Verification & Data Extraction:**
All four data series exhibit a positive, upward-sloping trend, indicating that Pass@k (%) increases as $k$ increases for all evaluated methods.
**1. RL (Red Line):**
* *Trend:* Slopes upward steadily. It starts as the highest performing method at $k=1$, ties/is slightly edged out at $k=2$, and falls to second place at $k=3$.
* *Data Points (Approximate values ±0.1):*
* $k=1$ ('x' marker): ~9.0%
* $k=2$ (circle marker): ~10.7%
* $k=3$ (circle marker): ~12.4%
**2. MT (Purple Line):**
* *Trend:* Exhibits the steepest upward slope. It starts in second place at $k=1$, converges with the RL line at $k=2$, and overtakes RL to become the highest performing method at $k=3$.
* *Data Points (Approximate values ±0.1):*
* $k=1$ ('x' marker): ~6.0%
* $k=2$ (circle marker): ~10.7% (Visually overlaps the red RL marker).
* $k=3$ (circle marker): ~12.7%
**3. SFT (Orange Line):**
* *Trend:* Slopes upward steadily, maintaining a consistent trajectory. It remains the third-highest performing method across all values of $k$.
* *Data Points (Approximate values ±0.1):*
* $k=1$ ('x' marker): ~5.3%
* $k=2$ (circle marker): ~7.7%
* $k=3$ (circle marker): ~9.7%
**4. Base (Blue Line):**
* *Trend:* Slopes upward steadily. It is the lowest performing method across all values of $k$.
* *Data Points (Approximate values ±0.1):*
* $k=1$ ('x' marker): ~2.7%
* $k=2$ (circle marker): ~5.0%
* $k=3$ (circle marker): ~8.0%
### Key Observations
* **Universal Improvement:** Every model benefits from an increased $k$ value, which is standard for "Pass@k" metrics (more attempts yield a higher probability of success).
* **The Crossover:** The most notable visual feature is the intersection of the Purple (MT) and Red (RL) lines at $k=2$. MT shows a much higher rate of improvement between $k=1$ and $k=2$ compared to RL.
* **Consistent Hierarchy at the Bottom:** The Base model (Blue) and SFT model (Orange) never intersect with each other or the top two models; their relative performance ranking remains static (SFT > Base).
* **Marker Distinction:** The deliberate use of 'x' markers at $k=1$ versus circles at $k=2, 3$ suggests a methodological distinction in how the first attempt is calculated or evaluated compared to subsequent attempts, though the chart does not explicitly explain this.
### Interpretation
This chart likely represents the evaluation of Large Language Models (LLMs) on a coding or reasoning benchmark where "Pass@k" measures the probability that at least one out of $k$ generated solutions is correct.
* **Base vs. Fine-tuned:** The "Base" model performs poorly. Applying Supervised Fine-Tuning ("SFT") roughly doubles the performance at $k=1$.
* **Advanced Techniques:** Reinforcement Learning ("RL") and what is likely Multi-Task training or a specific variant ("MT") significantly outperform SFT and Base.
* **RL vs. MT Trade-off:** The data suggests a distinct behavioral difference between RL and MT. RL is highly optimized for the "first try" ($k=1$), making it the best choice if only a single output is generated. However, MT has higher variance or diversity in its outputs; while its first guess is worse than RL's, giving it three guesses ($k=3$) results in a higher overall chance of success than giving RL three guesses. This implies MT explores a wider solution space, whereas RL might be more narrowly focused on a specific type of high-probability answer.