\n
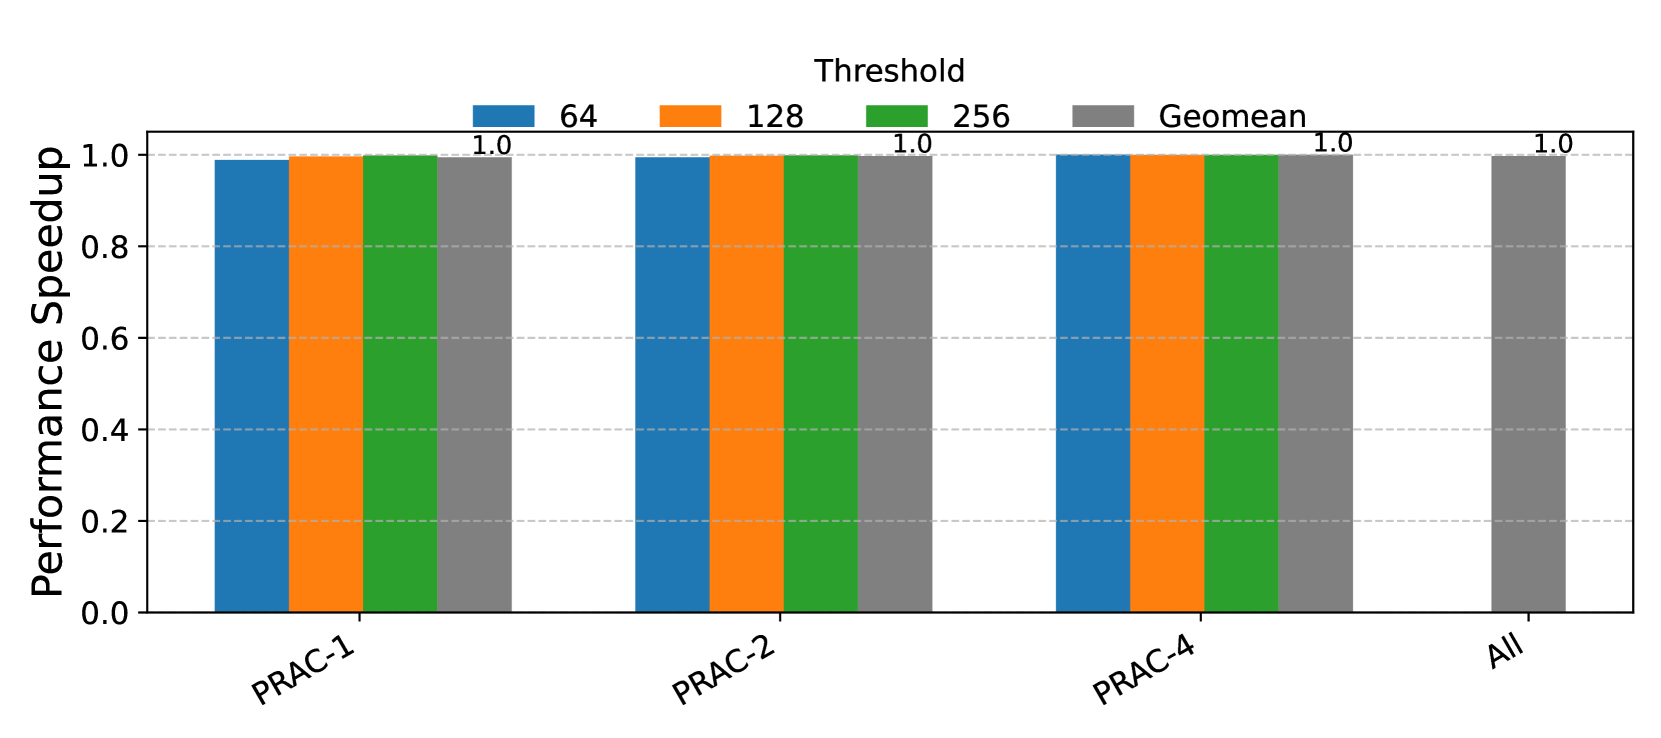
## Bar Chart: Performance Speedup vs. Threshold
### Overview
The image presents a bar chart comparing the performance speedup achieved for different PRAC configurations (PRAC-1, PRAC-2, PRAC-4, and All) across varying thresholds (64, 128, 256, and Geomean). The y-axis represents performance speedup, while the x-axis represents the PRAC configuration. Each PRAC configuration has four bars corresponding to the different thresholds.
### Components/Axes
* **X-axis:** PRAC Configurations - PRAC-1, PRAC-2, PRAC-4, All. The labels are positioned along the bottom of the chart, slightly rotated.
* **Y-axis:** Performance Speedup. The scale ranges from 0.0 to 1.0, with tick marks at 0.2 intervals. The label is positioned on the left side of the chart, vertically.
* **Legend:** Located at the top of the chart, horizontally centered. It maps colors to thresholds:
* Blue: 64
* Orange: 128
* Green: 256
* Gray/Black: Geomean
* **Title:** "Threshold" is centered above the bars.
### Detailed Analysis
The chart consists of 16 bars, grouped by PRAC configuration. Each group has four bars representing the speedup at thresholds 64, 128, 256, and Geomean.
* **PRAC-1:**
* Threshold 64 (Blue): Approximately 0.95 speedup.
* Threshold 128 (Orange): Approximately 0.95 speedup.
* Threshold 256 (Green): 1.0 speedup.
* Geomean (Gray): 1.0 speedup.
* **PRAC-2:**
* Threshold 64 (Blue): Approximately 0.95 speedup.
* Threshold 128 (Orange): Approximately 0.95 speedup.
* Threshold 256 (Green): 1.0 speedup.
* Geomean (Gray): 1.0 speedup.
* **PRAC-4:**
* Threshold 64 (Blue): Approximately 0.95 speedup.
* Threshold 128 (Orange): Approximately 0.95 speedup.
* Threshold 256 (Green): 1.0 speedup.
* Geomean (Gray): 1.0 speedup.
* **All:**
* Threshold 64 (Blue): Approximately 0.95 speedup.
* Threshold 128 (Orange): Approximately 0.95 speedup.
* Threshold 256 (Green): 1.0 speedup.
* Geomean (Gray): 1.0 speedup.
All bars for the Geomean threshold are at 1.0 speedup. The bars for thresholds 64 and 128 are consistently around 0.95 for all PRAC configurations. The bars for threshold 256 are at 1.0 speedup for all PRAC configurations.
### Key Observations
* The Geomean threshold consistently achieves a speedup of 1.0 across all PRAC configurations.
* Thresholds 64 and 128 yield a speedup of approximately 0.95 across all PRAC configurations.
* Threshold 256 yields a speedup of 1.0 across all PRAC configurations.
* There is no significant difference in performance speedup between the different PRAC configurations for any of the thresholds.
### Interpretation
The data suggests that increasing the threshold to 256 or using the Geomean threshold results in optimal performance (speedup of 1.0) for all PRAC configurations. Lower thresholds (64 and 128) provide a slightly lower speedup (approximately 0.95). The consistent performance across different PRAC configurations indicates that the threshold setting is the dominant factor influencing speedup, rather than the specific PRAC configuration itself. The Geomean threshold effectively represents the optimal balance across all configurations, resulting in the highest observed speedup. The lack of variation between PRAC configurations suggests that the benefits of different PRAC approaches are realized at higher thresholds.