## Line Chart: Llama-3-8B and Llama-3-70B Performance
### Overview
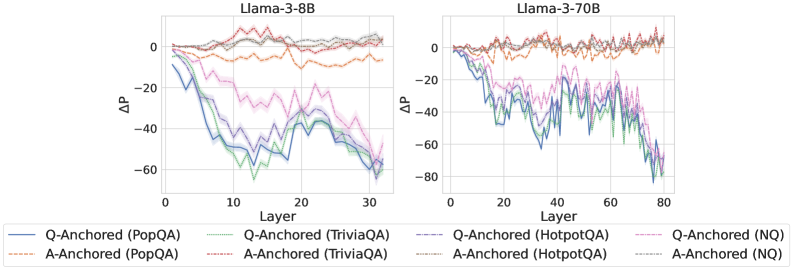
The image presents two line charts comparing the performance of Llama-3-8B and Llama-3-70B models across different layers. The y-axis represents ΔP (change in performance), and the x-axis represents the layer number. Each chart displays six data series, representing Q-Anchored and A-Anchored performance on PopQA, TriviaQA, HotpotQA, and NQ datasets.
### Components/Axes
* **Titles:**
* Left Chart: Llama-3-8B
* Right Chart: Llama-3-70B
* **Y-axis:**
* Label: ΔP
* Scale: -80 to 0, with increments of 20 (-60, -40, -20, 0)
* **X-axis:**
* Label: Layer
* Left Chart Scale: 0 to 30, with increments of 10 (10, 20, 30)
* Right Chart Scale: 0 to 80, with increments of 20 (20, 40, 60, 80)
* **Legend:** Located at the bottom of the image.
* Q-Anchored (PopQA): Solid Blue Line
* A-Anchored (PopQA): Dashed Brown Line
* Q-Anchored (TriviaQA): Dotted Green Line
* A-Anchored (TriviaQA): Dotted Brown Line
* Q-Anchored (HotpotQA): Dashed Purple Line
* A-Anchored (HotpotQA): Dotted Green Line
* Q-Anchored (NQ): Dotted Purple Line
* A-Anchored (NQ): Dotted Gray Line
### Detailed Analysis
**Llama-3-8B (Left Chart):**
* **Q-Anchored (PopQA):** (Solid Blue) Starts at approximately 0 and decreases to around -60 by layer 30.
* **A-Anchored (PopQA):** (Dashed Brown) Remains relatively stable around 0, with minor fluctuations.
* **Q-Anchored (TriviaQA):** (Dotted Green) Starts near 0 and decreases to approximately -60 by layer 30.
* **A-Anchored (TriviaQA):** (Dotted Brown) Remains relatively stable around 0, with minor fluctuations.
* **Q-Anchored (HotpotQA):** (Dashed Purple) Starts near 0 and decreases to approximately -40 by layer 30.
* **A-Anchored (HotpotQA):** (Dotted Green) Remains relatively stable around 0, with minor fluctuations.
* **Q-Anchored (NQ):** (Dotted Purple) Remains relatively stable around 0, with minor fluctuations.
* **A-Anchored (NQ):** (Dotted Gray) Remains relatively stable around 0, with minor fluctuations.
**Llama-3-70B (Right Chart):**
* **Q-Anchored (PopQA):** (Solid Blue) Starts at approximately 0 and decreases to around -80 by layer 80.
* **A-Anchored (PopQA):** (Dashed Brown) Remains relatively stable around 0, with minor fluctuations.
* **Q-Anchored (TriviaQA):** (Dotted Green) Starts near 0 and decreases to approximately -40 by layer 80.
* **A-Anchored (TriviaQA):** (Dotted Brown) Remains relatively stable around 0, with minor fluctuations.
* **Q-Anchored (HotpotQA):** (Dashed Purple) Starts near 0 and decreases to approximately -40 by layer 80.
* **A-Anchored (HotpotQA):** (Dotted Green) Remains relatively stable around 0, with minor fluctuations.
* **Q-Anchored (NQ):** (Dotted Purple) Remains relatively stable around 0, with minor fluctuations.
* **A-Anchored (NQ):** (Dotted Gray) Remains relatively stable around 0, with minor fluctuations.
### Key Observations
* For both models, the Q-Anchored performance on PopQA, TriviaQA, and HotpotQA datasets decreases significantly as the layer number increases.
* The A-Anchored performance on all datasets remains relatively stable around 0 for both models.
* The Llama-3-70B model has a longer x-axis (layer count) than the Llama-3-8B model.
* The Q-Anchored (PopQA) line for Llama-3-70B shows the most significant decrease in performance, reaching approximately -80.
### Interpretation
The data suggests that Q-Anchoring negatively impacts the performance of Llama models on PopQA, TriviaQA, and HotpotQA datasets as the model goes deeper into its layers. In contrast, A-Anchoring seems to have a negligible impact on performance. The Llama-3-70B model, with its increased number of layers, exhibits a more pronounced decrease in Q-Anchored performance, particularly for the PopQA dataset. This could indicate that the effect of Q-Anchoring becomes more detrimental with increased model depth. The stable performance of A-Anchored data suggests that anchoring the answer has little to no impact on the model's performance across different layers.