\n
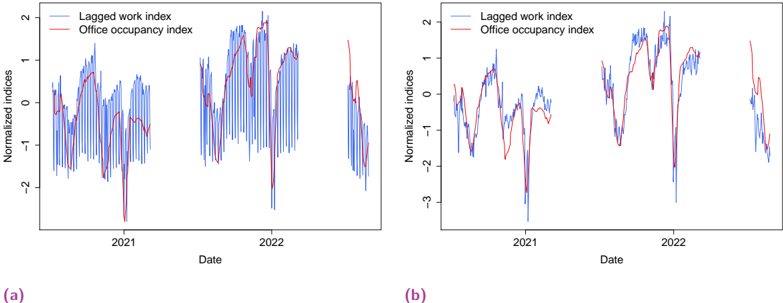
## Line Chart: Normalized Indices Over Time
### Overview
The image presents two line charts, labeled (a) and (b), displaying time series data for "Lagged work index" and "Office occupancy index" from approximately 2020 to 2022. Both charts share the same axes labels and legend, but display slightly different data patterns. The y-axis represents "Normalized indices" ranging from approximately -3 to 2, while the x-axis represents "Date".
### Components/Axes
* **X-axis:** "Date" - spanning from approximately early 2020 to late 2022. The scale is not explicitly marked, but the years 2021 and 2022 are clearly visible.
* **Y-axis:** "Normalized indices" - ranging from approximately -3 to 2. The scale is not explicitly marked with numerical values, but the range is visually discernible.
* **Legend:** Located in the top-right corner of each chart.
* "Lagged work index" - represented by a blue line.
* "Office occupancy index" - represented by a red line.
* **Chart (a):** Displays data from approximately January 2020 to December 2022.
* **Chart (b):** Displays data from approximately January 2020 to December 2022.
### Detailed Analysis or Content Details
**Chart (a):**
* **Lagged work index (Blue Line):** The line exhibits high-frequency oscillations throughout the period. It generally fluctuates around the 0 line. Around mid-2021, the line shows a period of sustained positive values, peaking at approximately 1.8. Towards the end of 2022, the line drops sharply to approximately -2.5.
* **Office occupancy index (Red Line):** This line also oscillates, but with larger amplitude swings than the lagged work index. It spends a significant portion of 2020 and early 2021 in negative territory, reaching a minimum of approximately -2.8. It rises to positive values in mid-2021, peaking around 1.5, and then declines sharply towards the end of 2022, reaching approximately -2.5.
**Chart (b):**
* **Lagged work index (Blue Line):** Similar to chart (a), the line oscillates frequently. It generally fluctuates around the 0 line. Around mid-2021, the line shows a period of sustained positive values, peaking at approximately 1.7. Towards the end of 2022, the line drops sharply to approximately -3.
* **Office occupancy index (Red Line):** This line also oscillates, but with larger amplitude swings than the lagged work index. It spends a significant portion of 2020 and early 2021 in negative territory, reaching a minimum of approximately -3.2. It rises to positive values in mid-2021, peaking around 1.6, and then declines sharply towards the end of 2022, reaching approximately -2.8.
### Key Observations
* Both indices exhibit a strong cyclical pattern, likely reflecting weekly or monthly variations.
* The Office occupancy index generally has a larger range of fluctuation than the Lagged work index.
* Both indices show a similar trend of increasing in mid-2021 and then decreasing sharply towards the end of 2022.
* Chart (b) shows a more pronounced dip in the Office occupancy index in early 2021 and a more significant drop at the end of 2022 compared to chart (a).
### Interpretation
The charts likely depict the relationship between work activity and office usage during the COVID-19 pandemic and its aftermath. The "Lagged work index" could represent a measure of overall work activity, while the "Office occupancy index" represents the physical presence of workers in office spaces.
The initial dip in the Office occupancy index in 2020 and early 2021 likely reflects the widespread shift to remote work due to the pandemic. The subsequent increase in both indices in mid-2021 suggests a partial return to office work as restrictions eased. The sharp decline at the end of 2022 could indicate a renewed shift towards remote work, potentially due to new variants or changing work policies.
The fact that the Office occupancy index has a larger range of fluctuation suggests that office usage is more sensitive to external factors (like pandemic waves or policy changes) than overall work activity. The slight differences between charts (a) and (b) could be due to different data sources, methodologies, or geographical locations. The "lagged" nature of the work index suggests that changes in work activity may influence, or be influenced by, office occupancy with a delay.