\n
## Line Chart: CIFAR-10 Test Accuracy vs. Parameter d1
### Overview
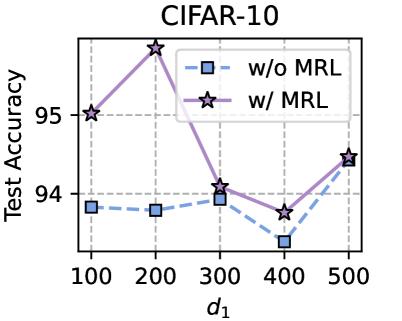
The image is a line chart comparing the test accuracy of two models on the CIFAR-10 dataset across different values of a parameter labeled `d1`. The chart demonstrates the performance impact of a technique or component referred to as "MRL".
### Components/Axes
* **Title:** "CIFAR-10" (centered at the top).
* **Y-Axis:** Labeled "Test Accuracy". The scale runs from approximately 93.5 to 96, with major grid lines and labels at 94 and 95.
* **X-Axis:** Labeled "d1". The scale has discrete markers at 100, 200, 300, 400, and 500.
* **Legend:** Located in the top-right quadrant of the chart area.
* **Series 1:** "w/o MRL" (without MRL). Represented by a blue dashed line (`--`) with square markers (`□`).
* **Series 2:** "w/ MRL" (with MRL). Represented by a purple solid line (`—`) with star markers (`☆`).
* **Grid:** A light gray dashed grid is present in the background.
### Detailed Analysis
**Data Series: "w/o MRL" (Blue Squares, Dashed Line)**
* **Trend:** The line shows relatively stable performance with a notable dip at `d1=400`.
* **Data Points (Approximate):**
* d1=100: ~93.9%
* d1=200: ~93.8%
* d1=300: ~94.1%
* d1=400: ~93.5% (lowest point)
* d1=500: ~94.5%
**Data Series: "w/ MRL" (Purple Stars, Solid Line)**
* **Trend:** The line shows a sharp peak at `d1=200`, followed by a decline and a partial recovery.
* **Data Points (Approximate):**
* d1=100: 95.0%
* d1=200: ~95.8% (highest point on the chart)
* d1=300: ~94.1%
* d1=400: ~93.8%
* d1=500: ~94.5%
### Key Observations
1. **Peak Performance:** The highest accuracy (~95.8%) is achieved by the "w/ MRL" model at `d1=200`.
2. **Performance Crossover:** The two models have nearly identical accuracy at `d1=300` (~94.1%) and `d1=500` (~94.5%).
3. **Significant Dip:** Both models experience their lowest performance at `d1=400`, with "w/o MRL" dropping more sharply.
4. **MRL Impact:** The "w/ MRL" model significantly outperforms the "w/o MRL" model at lower `d1` values (100 and 200), but this advantage disappears at higher values (300 and above).
### Interpretation
The chart suggests that the "MRL" technique provides a substantial accuracy boost for the CIFAR-10 task when the parameter `d1` is set to a low value (100-200). The peak at `d1=200` indicates an optimal configuration for the "w/ MRL" model. However, the benefit of MRL diminishes as `d1` increases beyond 200, with both models converging to similar performance at `d1=300` and `d1=500`. The universal dip at `d1=400` points to a potential problematic configuration or a common limitation in the model architecture or training regimen at that specific parameter setting. The data implies that `d1` is a critical hyperparameter whose optimal value is dependent on whether MRL is employed.