## Line Chart: Accuracy vs. Difficulty Level for Different Models
### Overview
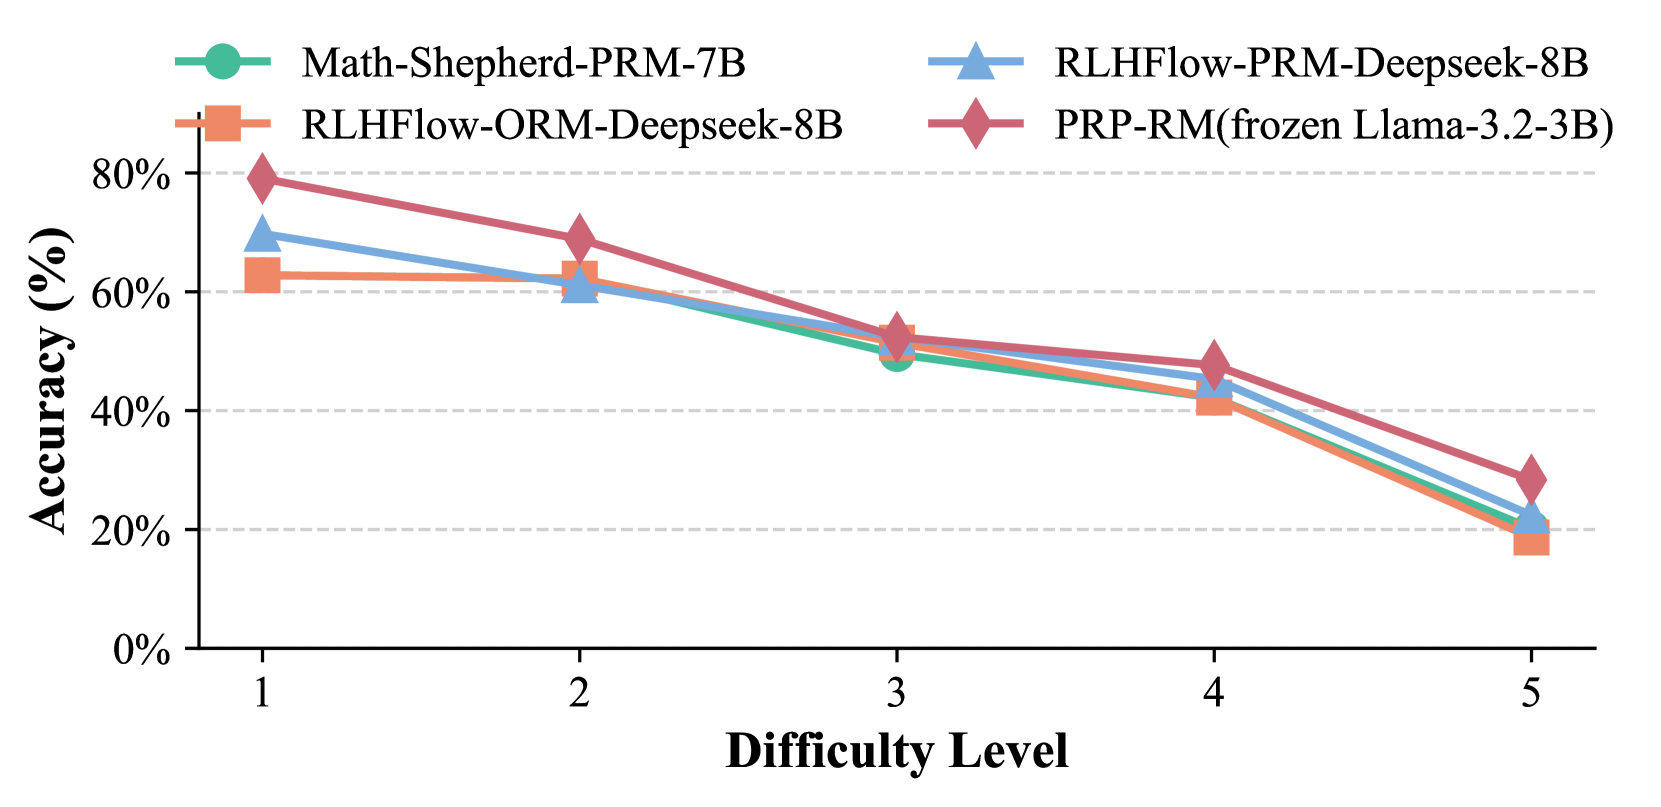
This line chart displays the accuracy of four different models – Math-Shepherd-PRM-7B, RLHFlow-PRM-Deepseek-8B, RLHFlow-ORM-Deepseek-8B, and PRP-RM(frozen Llama-3.2-3B) – across five levels of difficulty. Accuracy is measured in percentage, and the x-axis represents the difficulty level, ranging from 1 to 5. The chart uses different colored lines to represent each model, with a legend in the top-right corner.
### Components/Axes
* **X-axis:** Difficulty Level (1 to 5)
* **Y-axis:** Accuracy (%) - Scale ranges from 0% to 80% with increments of 20%.
* **Legend:** Located at the top-right corner, identifying each line with its corresponding model name and size.
* Math-Shepherd-PRM-7B (Light Green)
* RLHFlow-PRM-Deepseek-8B (Blue)
* RLHFlow-ORM-Deepseek-8B (Gray)
* PRP-RM(frozen Llama-3.2-3B) (Red-Brown)
* **Horizontal dashed lines:** at 20%, 40%, 60%, and 80% to aid in visual assessment of accuracy.
### Detailed Analysis
Here's a breakdown of each model's performance across the difficulty levels, based on the visual data:
* **Math-Shepherd-PRM-7B (Light Green):** This line starts at approximately 72% accuracy at Difficulty Level 1, then decreases steadily to around 22% at Difficulty Level 5.
* Difficulty 1: ~72%
* Difficulty 2: ~64%
* Difficulty 3: ~56%
* Difficulty 4: ~48%
* Difficulty 5: ~22%
* **RLHFlow-PRM-Deepseek-8B (Blue):** This line begins at approximately 62% accuracy at Difficulty Level 1, and declines to around 28% at Difficulty Level 5.
* Difficulty 1: ~62%
* Difficulty 2: ~60%
* Difficulty 3: ~52%
* Difficulty 4: ~44%
* Difficulty 5: ~28%
* **RLHFlow-ORM-Deepseek-8B (Gray):** This line starts at approximately 68% accuracy at Difficulty Level 1, and decreases to around 30% at Difficulty Level 5.
* Difficulty 1: ~68%
* Difficulty 2: ~66%
* Difficulty 3: ~54%
* Difficulty 4: ~46%
* Difficulty 5: ~30%
* **PRP-RM(frozen Llama-3.2-3B) (Red-Brown):** This line begins at approximately 60% accuracy at Difficulty Level 1, and declines to around 24% at Difficulty Level 5.
* Difficulty 1: ~60%
* Difficulty 2: ~58%
* Difficulty 3: ~50%
* Difficulty 4: ~42%
* Difficulty 5: ~24%
All lines exhibit a downward trend, indicating that accuracy decreases as the difficulty level increases.
### Key Observations
* All models show a decline in accuracy as the difficulty level increases.
* Math-Shepherd-PRM-7B consistently performs slightly better than the other models at lower difficulty levels (1 and 2).
* The accuracy of all models converges at higher difficulty levels (4 and 5), suggesting that all models struggle with the most challenging problems.
* The differences in accuracy between models are more pronounced at lower difficulty levels.
### Interpretation
The data suggests that all four models are capable of solving relatively simple problems (Difficulty Level 1), but their performance degrades significantly as the problems become more complex. The consistent downward trend across all models indicates that the difficulty level is a significant factor in determining accuracy. The initial performance advantage of Math-Shepherd-PRM-7B suggests it may be better suited for simpler tasks, while the convergence of all models at higher difficulty levels implies that all models face similar challenges when tackling complex problems. The fact that accuracy drops below 50% for all models at Difficulty Level 3 suggests that further improvements are needed to achieve high performance on more challenging tasks. The data could be used to inform model selection based on the expected difficulty of the problems to be solved, or to guide further research into improving the performance of these models on complex tasks.