\n
## Line Chart: Model Accuracy vs. Difficulty Level
### Overview
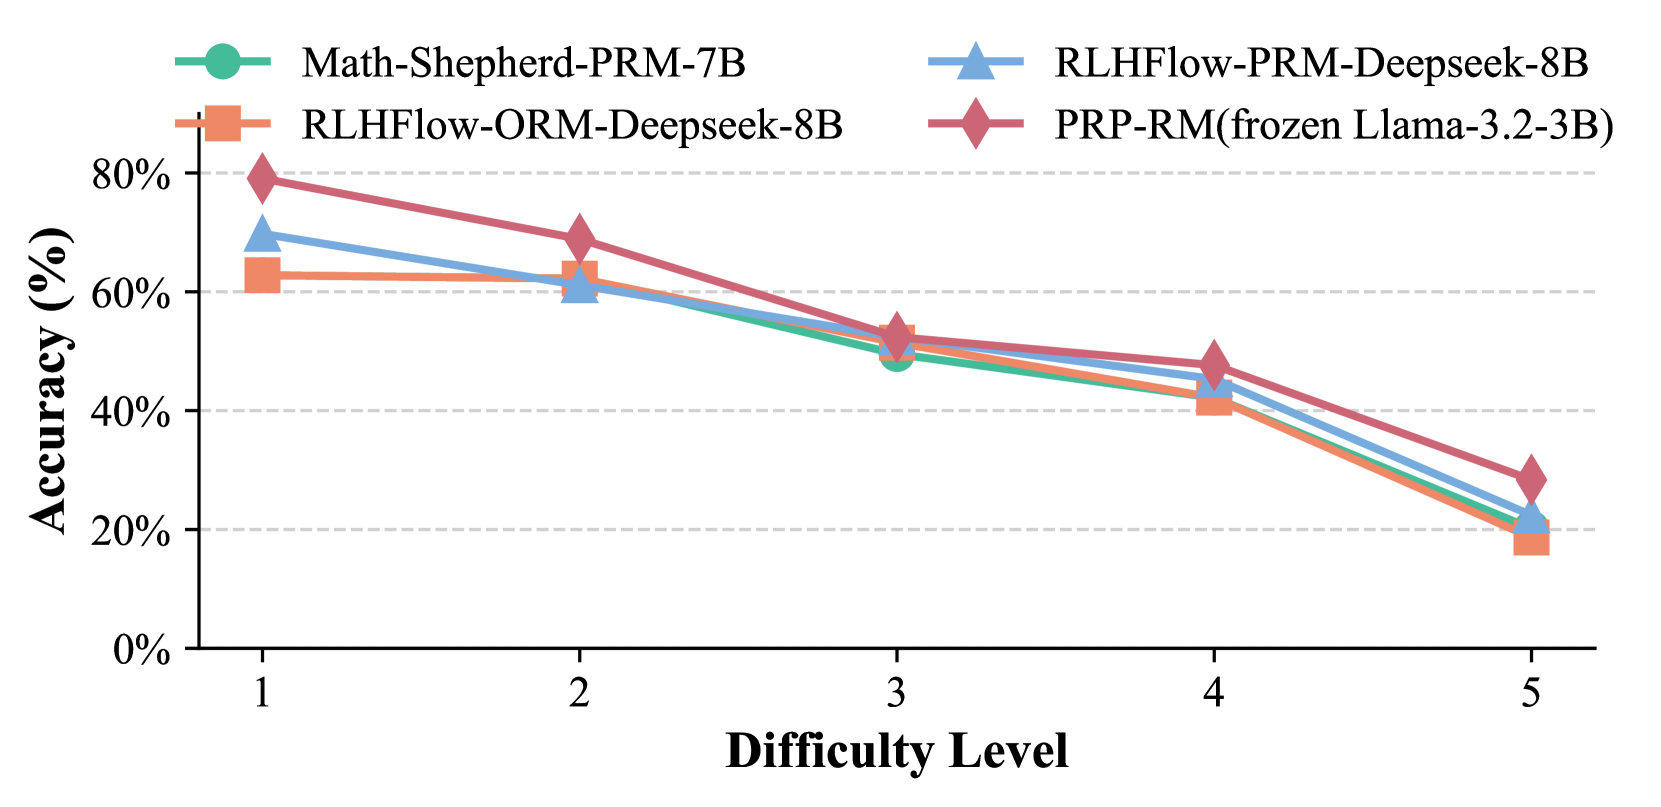
This is a line chart comparing the performance (accuracy) of four different AI models across five increasing levels of difficulty. The chart demonstrates a clear negative correlation between problem difficulty and model accuracy for all evaluated systems.
### Components/Axes
* **Y-Axis:** Labeled "Accuracy (%)". Scale ranges from 0% to 80% with major gridlines at 20% intervals (0%, 20%, 40%, 60%, 80%).
* **X-Axis:** Labeled "Difficulty Level". Discrete categories marked 1, 2, 3, 4, and 5.
* **Legend:** Positioned at the top center of the chart area. It defines four data series:
1. **Math-Shepherd-PRM-7B:** Represented by a teal line with circular markers.
2. **RLHFlow-ORM-Deepseek-8B:** Represented by an orange line with square markers.
3. **RLHFlow-PRM-Deepseek-8B:** Represented by a light blue line with upward-pointing triangle markers.
4. **PRP-RM(frozen Llama-3.2-3B):** Represented by a reddish-purple line with diamond markers.
### Detailed Analysis
All four models exhibit a consistent downward trend in accuracy as difficulty increases from level 1 to level 5.
**1. Math-Shepherd-PRM-7B (Teal, Circle)**
* **Trend:** Steady, near-linear decline.
* **Data Points (Approximate):**
* Difficulty 1: ~62%
* Difficulty 2: ~62%
* Difficulty 3: ~50%
* Difficulty 4: ~42%
* Difficulty 5: ~20%
**2. RLHFlow-ORM-Deepseek-8B (Orange, Square)**
* **Trend:** Declines steadily, with a notably steeper drop between levels 4 and 5.
* **Data Points (Approximate):**
* Difficulty 1: ~62%
* Difficulty 2: ~62%
* Difficulty 3: ~52%
* Difficulty 4: ~42%
* Difficulty 5: ~18%
**3. RLHFlow-PRM-Deepseek-8B (Light Blue, Triangle)**
* **Trend:** Consistent decline, closely mirroring the teal line but starting slightly higher.
* **Data Points (Approximate):**
* Difficulty 1: ~70%
* Difficulty 2: ~60%
* Difficulty 3: ~52%
* Difficulty 4: ~45%
* Difficulty 5: ~22%
**4. PRP-RM(frozen Llama-3.2-3B) (Reddish-Purple, Diamond)**
* **Trend:** Starts as the highest-performing model but experiences the most significant absolute drop in accuracy.
* **Data Points (Approximate):**
* Difficulty 1: ~80%
* Difficulty 2: ~70%
* Difficulty 3: ~52%
* Difficulty 4: ~48%
* Difficulty 5: ~28%
### Key Observations
* **Performance Hierarchy at Low Difficulty:** At Difficulty Level 1, the PRP-RM model (~80%) significantly outperforms the other three models, which cluster between ~62-70%.
* **Convergence at Mid Difficulty:** At Difficulty Level 3, all four models converge to a very similar accuracy range of approximately 50-52%.
* **Universal Performance Degradation:** No model maintains high accuracy at the highest difficulty (Level 5). All fall to between ~18% and ~28%.
* **Steep Final Drop:** All models show their steepest decline in accuracy between Difficulty Levels 4 and 5.
* **Close Pairing:** The two RLHFlow models (ORM and PRM variants) and the Math-Shepherd model show very similar performance profiles, especially from Difficulty 2 onward.
### Interpretation
The chart illustrates a fundamental challenge in AI model evaluation: performance is highly sensitive to problem difficulty. The data suggests that while certain architectures or training methods (like PRP-RM) can provide a substantial advantage on easier tasks, this advantage diminishes as complexity increases. The convergence of all models at mid-level difficulty indicates a common performance bottleneck. The sharp drop at the highest difficulty level implies that current models, regardless of their specific design (PRM vs. ORM, different base models), struggle significantly with the most complex problems in this benchmark. This highlights a critical area for future research and development—improving robustness and reasoning capabilities on high-difficulty tasks. The near-identical performance of the 8B-parameter RLHFlow models suggests that within that specific training framework, the choice between ORM (Outcome Reward Model) and PRM (Process Reward Model) may have a marginal impact compared to the overarching effect of problem difficulty.