## Line Chart: Validation Loss vs. FLOPs
### Overview
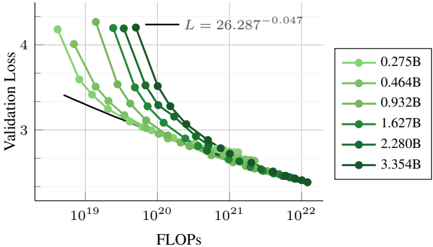
The chart illustrates the relationship between computational resources (FLOPs) and model performance (Validation Loss) for multiple machine learning models of varying sizes. It shows how Validation Loss decreases as FLOPs increase, with distinct trends for different model scales.
### Components/Axes
- **X-axis (FLOPs)**: Logarithmic scale from 10¹⁹ to 10²², labeled "FLOPs".
- **Y-axis (Validation Loss)**: Linear scale from 2.5 to 4.5, labeled "Validation Loss".
- **Legend**: Positioned on the right, mapping model sizes (e.g., 0.275B, 0.464B) to colors and markers.
- **Trend Line**: Black dashed line labeled "L = 26.287⁻⁰·⁰⁴⁷", indicating a logarithmic decay trend.
### Detailed Analysis
- **Model Sizes and Trends**:
- **0.275B (light green circles)**: Starts at ~4.2 Validation Loss at 10¹⁹ FLOPs, decreasing to ~2.8 at 10²² FLOPs.
- **0.464B (medium green squares)**: Begins at ~3.8 at 10¹⁹ FLOPs, dropping to ~2.7 at 10²² FLOPs.
- **0.932B (dark green triangles)**: Starts at ~3.5 at 10¹⁹ FLOPs, reaching ~2.6 at 10²² FLOPs.
- **1.627B (dark green diamonds)**: Begins at ~3.3 at 10¹⁹ FLOPs, decreasing to ~2.5 at 10²² FLOPs.
- **2.280B (dark green pentagons)**: Starts at ~3.1 at 10¹⁹ FLOPs, dropping to ~2.4 at 10²² FLOPs.
- **3.354B (dark green hexagons)**: Begins at ~2.9 at 10¹⁹ FLOPs, reaching ~2.3 at 10²² FLOPs.
- **Trend Line**: The black dashed line follows a power-law decay, suggesting Validation Loss decreases polynomially with increasing FLOPs. The exponent (-0.047) indicates diminishing returns as FLOPs grow.
### Key Observations
1. **Diminishing Returns**: All models show decreasing Validation Loss with more FLOPs, but the rate of improvement slows significantly at higher FLOP ranges.
2. **Model Efficiency**: Larger models (e.g., 3.354B) achieve lower Validation Loss at the same FLOP levels compared to smaller models, suggesting better parameter efficiency.
3. **Consistency**: The trend line aligns closely with all data series, confirming a universal relationship between FLOPs and Validation Loss across model sizes.
### Interpretation
The data demonstrates that increasing computational resources (FLOPs) improves model performance (lower Validation Loss), but the benefits plateau as FLOPs scale. Larger models (e.g., 3.354B) are more efficient, achieving lower loss with fewer FLOPs than smaller models. The trend line’s shallow slope (-0.047) implies that doubling FLOPs reduces Validation Loss by only ~1.1% (26.287⁻⁰·⁰⁴⁷ ≈ 0.989), highlighting the challenges of scaling deep learning systems. This suggests trade-offs between resource allocation and performance gains, critical for optimizing training pipelines.