\n
## Image Analysis: Image Quality Comparison
### Overview
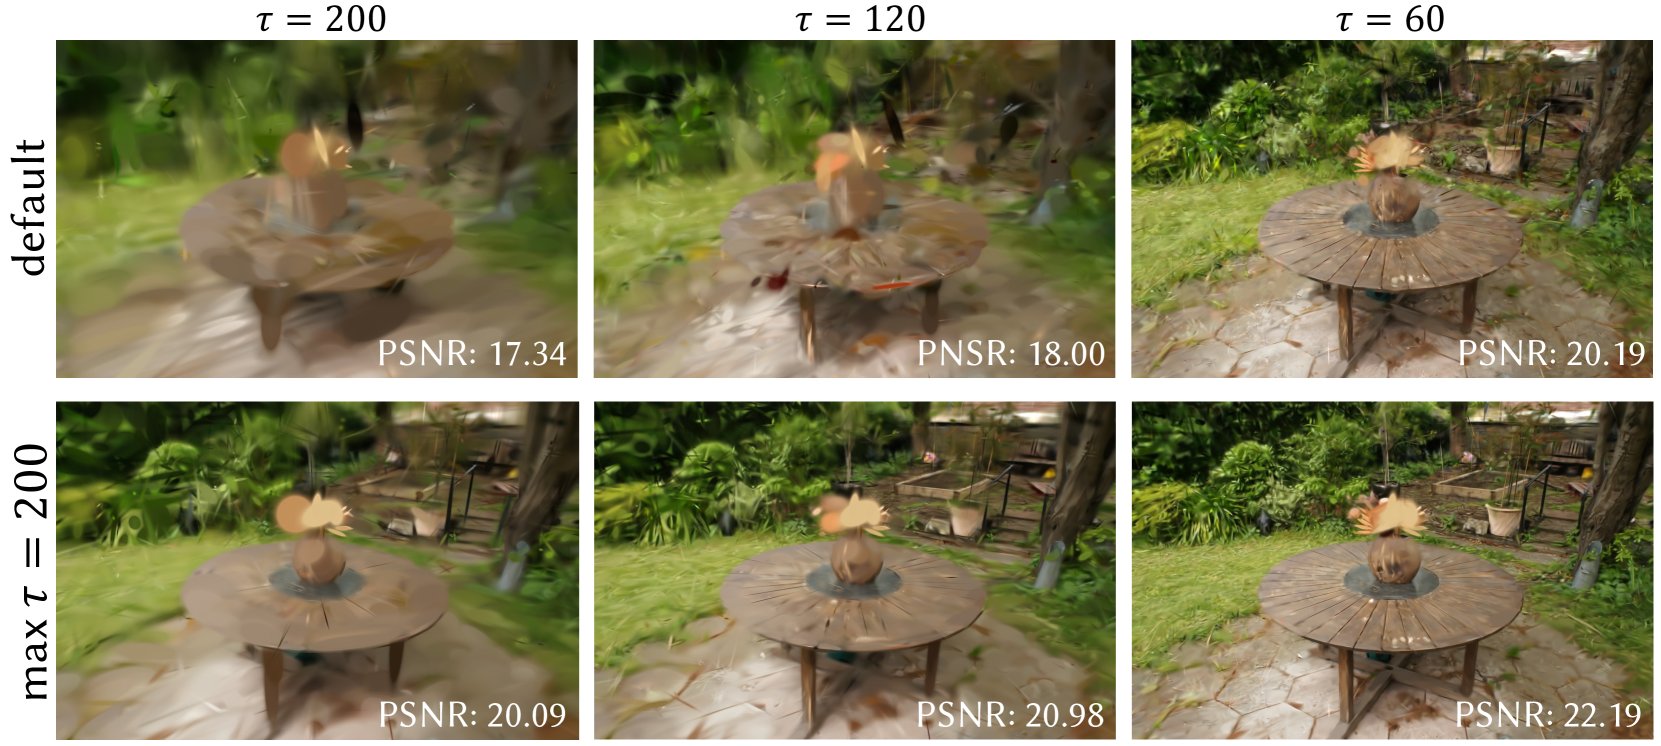
The image presents a 2x3 grid of rendered scenes, comparing image quality based on different values of a parameter τ (tau) and a setting "default" vs. "max τ = 200". Each scene depicts a circular wooden table with a bowl in the center, set in a garden-like environment. The image quality is quantified by the Peak Signal-to-Noise Ratio (PSNR) value displayed below each image.
### Components/Axes
The image is organized as a matrix with two rows and three columns.
* **Rows:** Represent two settings: "default" (top row) and "max τ = 200" (bottom row). The row labels are positioned on the left side of the image.
* **Columns:** Represent three different values of the parameter τ: 200, 120, and 60. The column labels are positioned at the top of the image.
* **PSNR Values:** Each image has a PSNR value displayed in the bottom-right corner.
### Detailed Analysis or Content Details
The images show a progression of clarity as τ decreases from 200 to 60, and as the setting changes from "default" to "max τ = 200".
**Row 1: default**
* **τ = 200:** PSNR: 17.34. The image appears blurry and lacks detail.
* **τ = 120:** PSNR: 18.00. Slightly sharper than the previous image, but still noticeably blurry.
* **τ = 60:** PSNR: 20.19. The image is significantly sharper and more detailed than the previous two, with clearer textures and edges.
**Row 2: max τ = 200**
* **τ = 200:** PSNR: 20.09. The image is sharper than the default τ=200 image, with more defined details.
* **τ = 120:** PSNR: 20.98. Further improvement in sharpness and detail compared to the previous image.
* **τ = 60:** PSNR: 22.19. The sharpest and most detailed image in the entire grid, with very clear textures and edges.
### Key Observations
* **PSNR and Clarity:** There is a clear positive correlation between PSNR value and image clarity. Higher PSNR values correspond to sharper, more detailed images.
* **τ Value:** Decreasing τ from 200 to 60 consistently improves image quality (increases PSNR).
* **"max τ = 200" Setting:** Using the "max τ = 200" setting consistently results in higher PSNR values and better image quality compared to the "default" setting for the same τ value.
* **Largest Improvement:** The largest improvement in PSNR is observed when changing from τ = 200 to τ = 60, particularly when combined with the "max τ = 200" setting.
### Interpretation
The data suggests that the parameter τ controls the level of detail or sharpness in the rendered images. Lower values of τ lead to sharper images, as indicated by the increasing PSNR values. The "max τ = 200" setting appears to optimize the rendering process, resulting in consistently higher image quality across all τ values.
The images demonstrate a trade-off between computational cost and image quality. Lowering τ likely requires more processing power, but yields a visually superior result. The "default" setting may prioritize speed over quality, while "max τ = 200" prioritizes quality.
The consistent improvement in PSNR with decreasing τ and the "max τ = 200" setting indicates that the rendering algorithm is sensitive to these parameters. The outlier is the significant jump in PSNR when switching to "max τ = 200" at τ=60, suggesting a synergistic effect between these settings. This could be due to the algorithm utilizing a more sophisticated filtering or anti-aliasing technique when "max τ = 200" is enabled.