## Comparative Image Reconstruction Chart: Effect of τ Parameter on Visual Quality and PSNR
### Overview
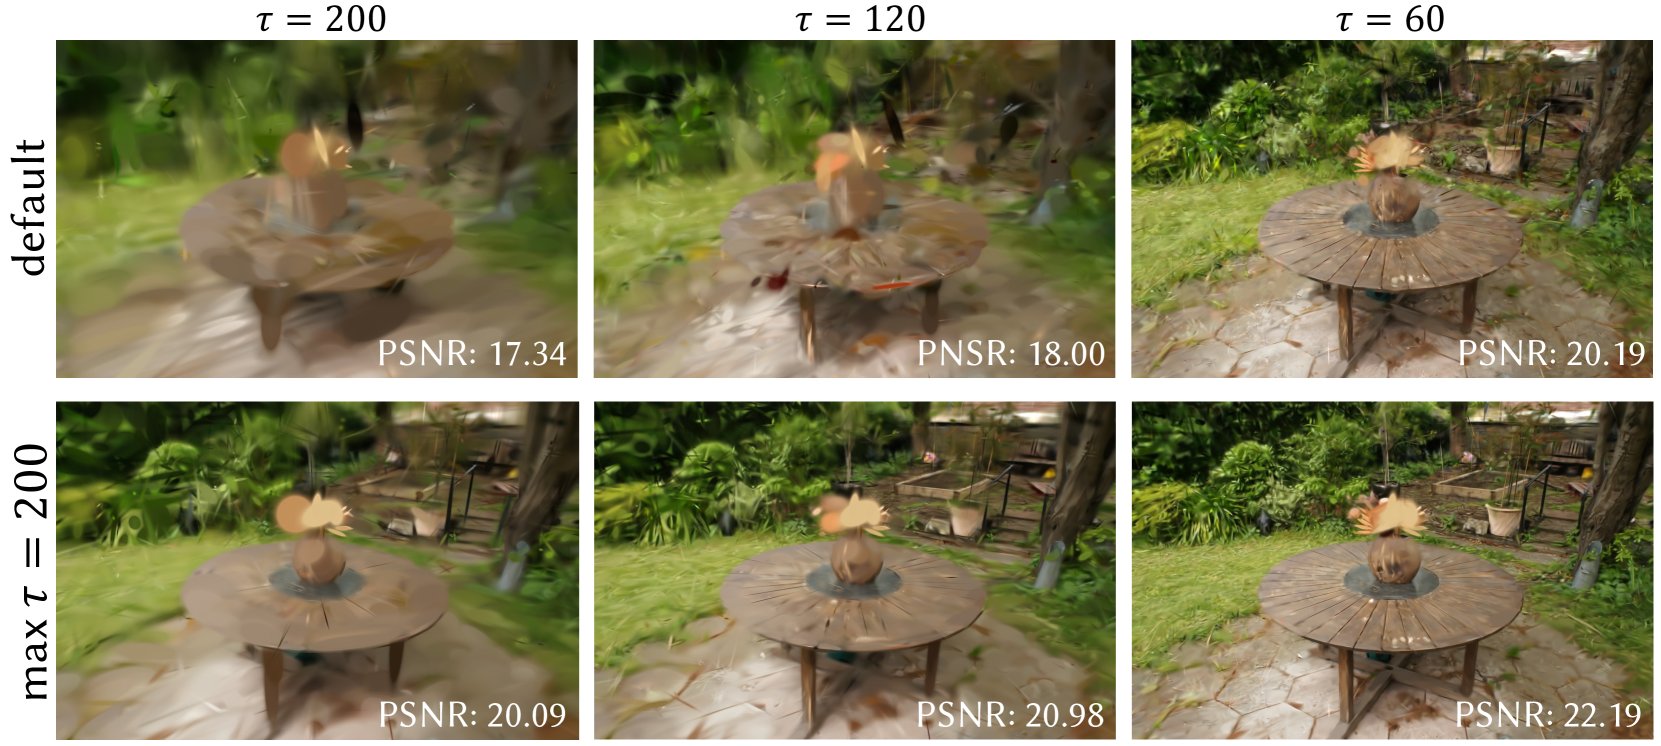
The image is a 2x3 comparative grid displaying the results of an image reconstruction or rendering algorithm under different parameter settings. It visually and quantitatively demonstrates how two variables—the row condition ("default" vs. "max τ = 200") and the column parameter (τ = 200, 120, 60)—affect the clarity and fidelity of a reconstructed scene featuring a wooden table with a plant in an outdoor garden setting.
### Components/Axes
* **Row Labels (Y-Axis):** Located vertically on the far left.
* Top Row: `default`
* Bottom Row: `max τ = 200`
* **Column Headers (X-Axis):** Located horizontally at the top of each column.
* Left Column: `τ = 200`
* Middle Column: `τ = 120`
* Right Column: `τ = 60`
* **Data Metric:** Peak Signal-to-Noise Ratio (PSNR) is displayed as white text in the bottom-right corner of each sub-image. PSNR is a standard metric for measuring image reconstruction quality, where higher values indicate better fidelity to a reference image.
* **Visual Content:** Each of the six panels shows the same core scene: a round, slatted wooden table on a stone patio, with a potted plant (resembling a small palm or cycad) on top, surrounded by lush green foliage and garden elements.
### Detailed Analysis
The grid allows for a direct comparison across two dimensions: the algorithm variant (row) and the τ parameter (column).
**Row 1: "default" method**
* **τ = 200 (Top-Left):** The image is severely blurred and distorted. Details of the table, plant, and background are smeared and lack definition. **PSNR: 17.34**
* **τ = 120 (Top-Middle):** Significant improvement in clarity over τ=200. The table's shape and the plant are more recognizable, but substantial blurring and artifacts remain, especially in the foliage. **PSNR: 18.00**
* **τ = 60 (Top-Right):** The image is much sharper. The table's wood grain, the plant's leaves, and background details like a fence and other pots are clearly visible. Some minor softness remains. **PSNR: 20.19**
**Row 2: "max τ = 200" method**
* **τ = 200 (Bottom-Left):** This image is dramatically clearer than its "default" counterpart in the same column. The table and plant are well-defined, though the background foliage is still somewhat soft. **PSNR: 20.09**
* **τ = 120 (Bottom-Middle):** Shows a slight but consistent improvement in sharpness and detail over the τ=200 result in this row. **PSNR: 20.98**
* **τ = 60 (Bottom-Right):** This is the sharpest and highest-fidelity image in the entire grid. Fine details in the wood, stone, and individual leaves are crisp. **PSNR: 22.19**
**Visual Trend Verification:**
* **Across Columns (Left to Right):** For both rows, as τ decreases from 200 to 60, the visual clarity improves monotonically. The images transition from heavily blurred to sharp. This trend is confirmed by the PSNR values, which increase steadily from left to right in each row.
* **Across Rows (Top to Bottom):** For every given τ value, the "max τ = 200" method produces a significantly clearer image with fewer artifacts than the "default" method. This is also confirmed by the PSNR values, which are substantially higher in the bottom row for each corresponding column.
### Key Observations
1. **Parameter Sensitivity:** The quality of the "default" method is highly sensitive to the τ parameter. A high τ (200) yields unusable results, while a lower τ (60) produces acceptable quality.
2. **Method Superiority:** The "max τ = 200" method is robust and superior across all tested τ values. Even at the highest τ (200), it outperforms the "default" method at its best setting (τ=60) in terms of PSNR (20.09 vs. 20.19, nearly equal) and visually appears comparable or better.
3. **Diminishing Returns:** The improvement in PSNR when moving from τ=120 to τ=60 is smaller than the jump from τ=200 to τ=120, especially for the "max τ = 200" row (ΔPSNR: ~1.2 vs. ~0.9). This suggests a potential point of diminishing returns for lowering τ further.
4. **PSNR-Visual Correlation:** There is a strong, direct correlation between the quantitative PSNR metric and the qualitative visual assessment in this chart. Higher PSNR consistently corresponds to a sharper, more detailed image.
### Interpretation
This chart is likely from a research paper or technical report on neural rendering, view synthesis, or image reconstruction (e.g., NeRF, 3D Gaussian Splatting). The parameter **τ** (tau) probably controls a key aspect of the algorithm, such as the number of optimization iterations, a sampling rate, or a threshold for density/opacity pruning.
The data demonstrates two key findings:
1. **The "max τ = 200" variant is a more effective algorithm.** It achieves high-quality results even with a parameter setting (τ=200) that causes the default method to fail. This suggests it has a better underlying model or optimization strategy that is less prone to the artifacts (like blurring and distortion) seen in the default method at high τ.
2. **Lower τ values improve quality for both methods, but with a cost.** While not stated in the image, in such algorithms, a lower τ (e.g., fewer iterations or more aggressive pruning) typically correlates with **faster computation or lower memory usage**. Therefore, the chart illustrates a critical trade-off: the "max τ = 200" method allows one to achieve high visual quality (high PSNR) **without** needing to lower τ to its minimum, potentially saving computational resources. It provides a better quality-speed Pareto frontier.
**In summary, the chart provides evidence that the proposed "max τ = 200" method is more robust and efficient, delivering higher fidelity reconstructions across a range of operational parameters compared to the default approach.**